Capture Network Diagnostic Information using Cisco Business Dashboard
Available Languages
Objective
Cisco Business Dashboard provides tools that help you easily monitor, manage, and configure your Cisco 100 to 500 Series network devices such as switches, routers, and wireless access points (WAPs) using your web browser. It also notifies you about device and Cisco Support notifications such as the availability of new firmware, device status, network settings updates, and any connected devices that are no longer under warranty or covered by a support contract.
Cisco Business Dashboard is a distributed application that consists of two separate components or interfaces: one or more Probes referred to as Cisco Business Dashboard Probe and a single Dashboard called Cisco Business Dashboard.
Cisco Business Dashboard provides a tool to help diagnose problems in the network. The Network Show Tech feature allows you to easily capture diagnostic information for your network in a form which you can analyze later or send to a support engineer. A Network Show Tech can be generated from the Dashboard User Interface (UI) or directly from the Probe UI in the event you are troubleshooting problems with the Dashboard-Probe connection.
This article provides instructions on how to capture diagnostic information using Cisco Business Dashboard.
Applicable Devices | Software Version
- Cisco Business Dashboard | 2.2
Capture Network Diagnostic Information
Gather Diagnostic Data
Step 1
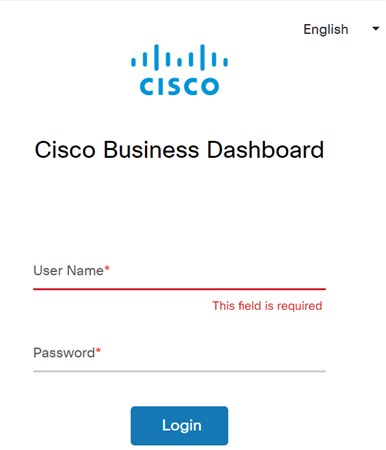
Log in to the Cisco Business Dashboard Administration User Interface.

Step 2
Click the menu button.

Step 3
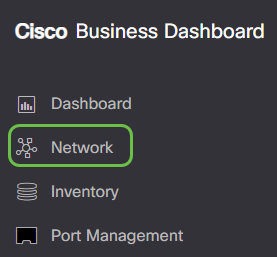
Click the Network button.

Step 4
Select the Network for which you want to collect diagnostic information.

Step 5
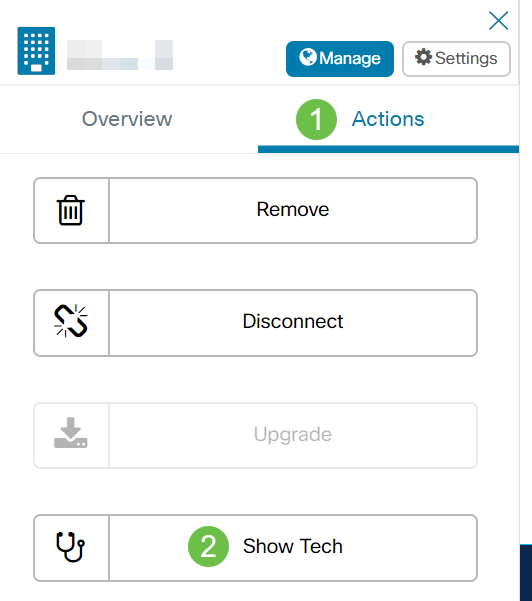
Choose the Actions tab and Show Tech.

Alternatively, log on to the Probe UI and navigate to Troubleshooting > Network Show Tech.
Step 6
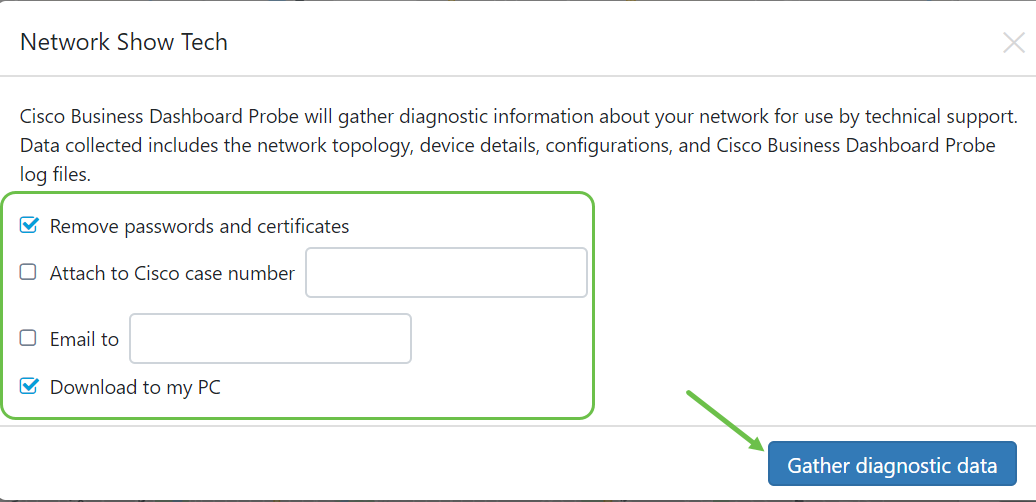
Use the check boxes to control whether or not to exclude passwords and certificates from device configurations, and where the diagnostic information should be sent. In addition, you can attach the diagnostic information to an existing Cisco support case. When you have finished your selections, click the Gather diagnostic data button.

If you are generating the Network Show Tech from the Probe, you do not have the options to email or attach to a support case. You must download the diagnostic information to your PC.
Step 7
A pop-up will appear, confirming the download.

You should now have successfully gathered diagnostic data of your network. The exported file is named show-tech.zip.
Access the Diagnostic Data
The diagnostic information is exported as a zip file. To access the data, follow these steps:
Step 1
If you checked the Download to my PC, go to the Downloads folder of your computer. Otherwise, check the email address used in Step 6.

In this example, the diagnostic data is saved in the Downloads folder.
Step 2
Right-click the show-tech zip file then click Extract All to unzip the diagnostic information to your preferred location.

The instructions may vary depending on the operating system that you have. In this example, Windows 10 is used.
Step 3
Double-click on the showtech folder to access the files.

Step 4
Double-click on the index.html file to view the exported diagnostic data.

You should now have accessed the exported diagnostic data from your computer.
Contact Cisco
- Open a Support Case

- (Requires a Cisco Service Contract)
 Feedback