Introduction
This document describes how to configure an Ethernet traffic monitoring session on UCS. Traffic monitoring copies traffic from one or more sources and sends the copied traffic to a dedicated destination port for analysis by a network analyzer. This feature is also known as Switched Port Analyzer (SPAN).
Contributed by Vignesh Kumar, Avinash Shukla Cisco TAC Engineers.
Prerequisites
Requirements
Cisco Recommends you to have a knowledge of ,
- Cisco UCS and different types of ports on Fabric Interconnect.
- Network capture tools (example -Wireshark)
Components Used
The information in this document is based on these hardware & software components:
- Cisco UCS Fabric Interconnect (any software version)
- UCS B-series or C-series server
- GLC-T ( 1-Gigabit Transceiver)
- CAT 5 cable
- Laptop/PC with 1 GB ethernet port & network capture tool (wireshark) installed
The information in this document was created from the devices in a specific lab environment. All of the devices used in this document started with a cleared (default) configuration. If your network is live, make sure that you understand the potential impact of any changes or configurations.
Network Diagram
Configurations
Configure
Creating an Ethernet Traffic Monitoring Session
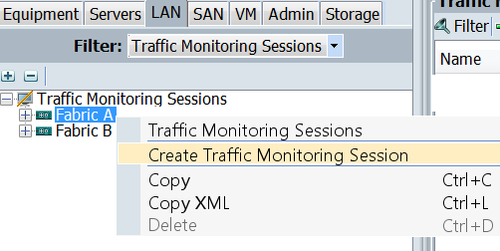
Step 1. In the Navigation pane, click the LAN tab.
Step 2. Navigate to Traffic Monitoring Sessions > Fabric_Interconnect_Name
Step 3. Right-click Fabric_Interconnect_Name and choose Create Traffic Monitoring Session ( Fig 1 )
Fig 1
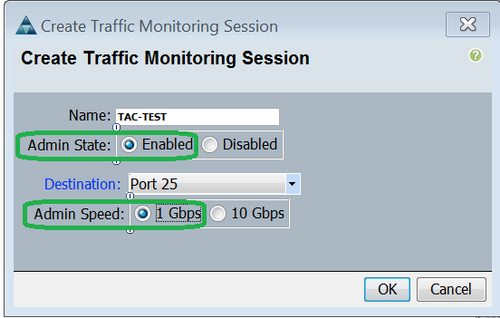
Step 4. In the Create Traffic Monitoring Session dialog box, give a Name to the monitoring session, select the Admin state to Enabled, Destination port ( in this case it is 25 ) and Admin speed to 1Gbps ( Fig 2 )
Fig 2
Step 5. Click OK.
Step 6. Traffic monitoring session details will appear in the right pane ( Fig 3 )
Fig 3

Step 7. Double clicking the TAC-TEST session will give the properties as below ( Fig 4 )
Fig 4
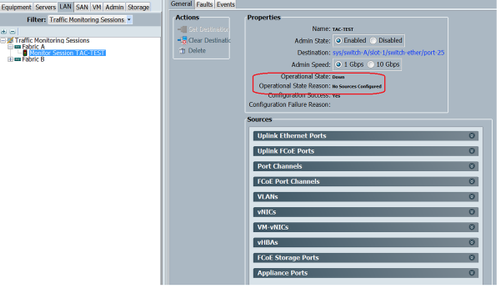
The operational status is down and that is because no source is configured ( highlighted in red )
Adding Traffic Sources to a Monitoring Session
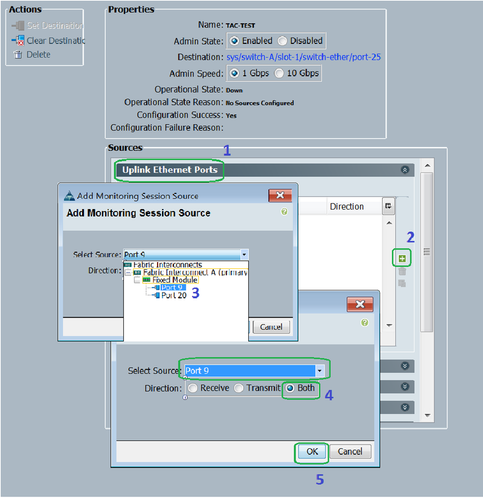
Step1. In the Sources area, expand the section for the type of traffic source that you want to add, in this case it would be Uplink Etherner Ports (Fig 5)
Step 2. To see the components that are available for monitoring, click the + button in the right-hand edge of the table to open the Add Monitoring Session Source dialog box.
Step 3. Select the uplink interface that we are interested in, in this case it would be ethernet 1/9.
Step 4. Select the direction as per the requirement, here option both has selected to monitor traffic on both sides.
Step 5. Click OK
Fig 5
Verify
UCS CLI
From nx-os mode, execute
Step 1. Show running interface eth 1/25
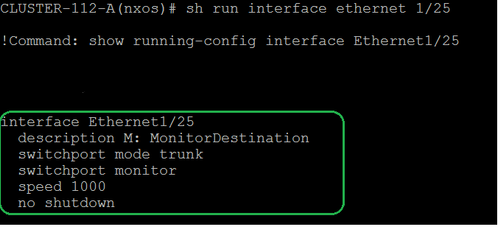
Step 2. Show interface eth 1/25
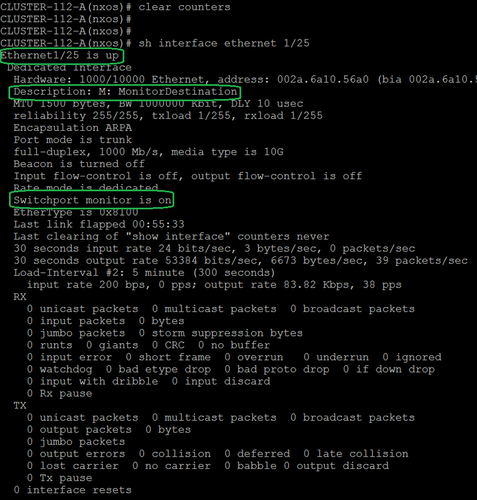
Step 3. Show interface eth 1/25 transceiver
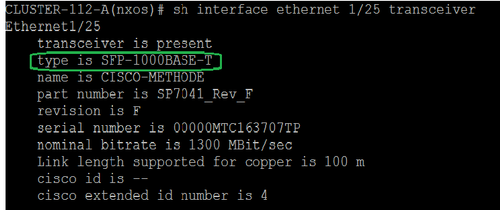
Note: SFP type here shows as SFP-1000BASE-T
UCS GUI
Step 1. In the navigation pane, under Equipment tab > Fabric_Interconnect_Name , highlight the port that is configured for destination ( Fig 6 )
Fig 6
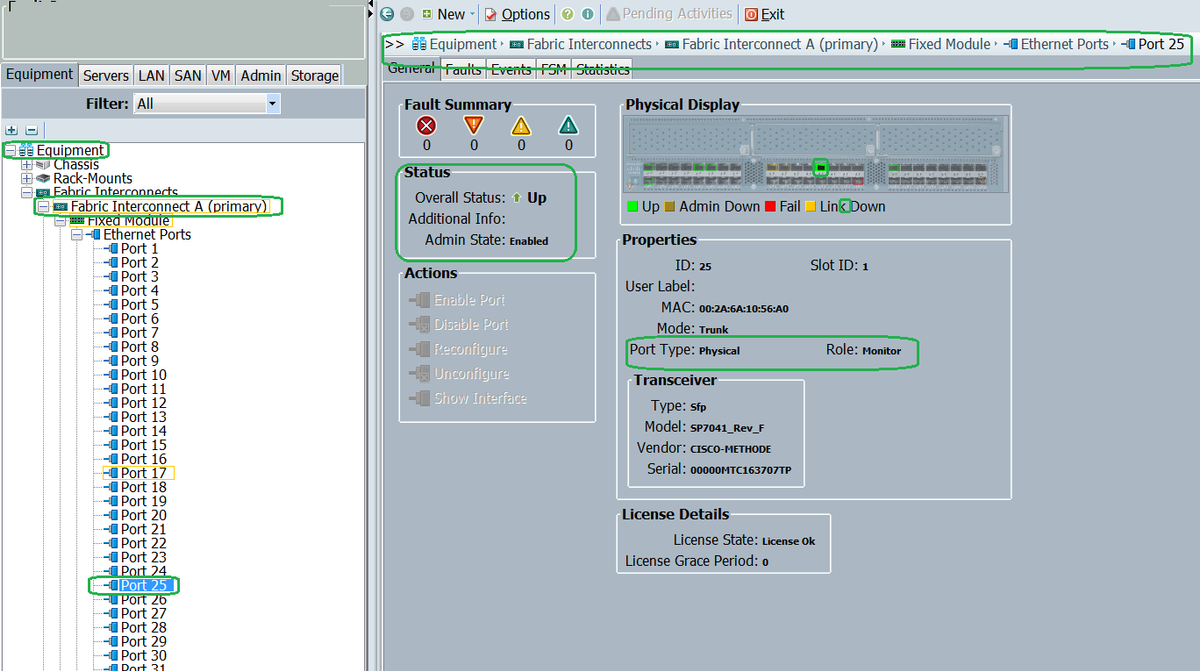
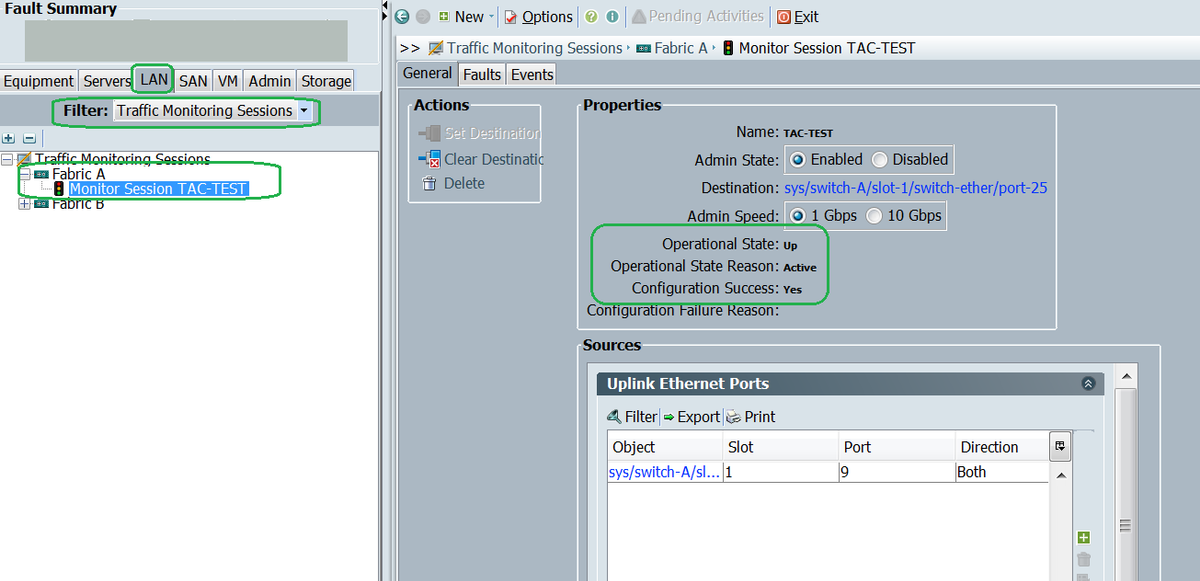
Step 2. In the Navigation pane, click the LAN tab, click Filter: Traffic Monitoring Sessions > Fabric_Interconnect_Name > Monitor session( Fig 7 )
Fig 7
Laptop/PC
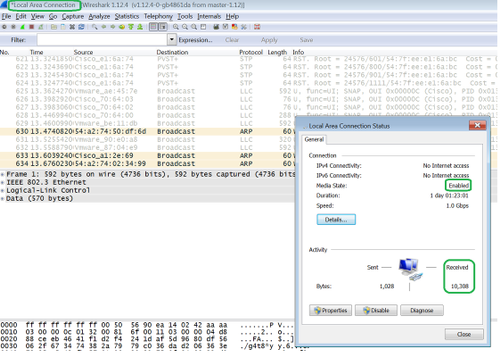
Step 1. Before initiating the wireshark tool ( Fig 8 )
Fig 8

2. After initiatiating the wireshark tool, the received packet count has increased ( Fig 9)
Fig 9
Troubleshoot
- If the destination port is down, check the SFP, cable.
- If problem is not with SFP / cable, kindly check the status by configuring different source and destination pair.
- If problem is still there, kindly check with other FI or device.
- Check the model of Fabric Interconnect. Fabric Interconnect 6120 supports 1 Gig interfaces only on the first 8 ports. http://www.cisco.com/c/en/us/td/docs/unified_computing/ucs/hw/switch/install/ucs6100_install/overvie...
