Introduction
This document describes Process Status and how to use this to troubleshoot Secure Web Appliance (SWA), performance issue.
Prerequisites
Requirements
Cisco recommends that you have knowledge of these topics:
- Physical or Virtual SWA Installed.
- License activated or installed.
- Secure Shell (SSH) Client.
- The setup wizard is completed.
- Administrative Access to the SWA.
Components Used
This document is not restricted to specific software and hardware versions.
The information in this document was created from the devices in a specific lab environment. All of the devices used in this document started with a cleared (default) configuration. If your network is live, ensure that you understand the potential impact of any command.
Monitor Process Status
You can monitor process Status from Graphical User Interface (GUI) or from Command Line Interface (CLI).
View Process Status from GUI
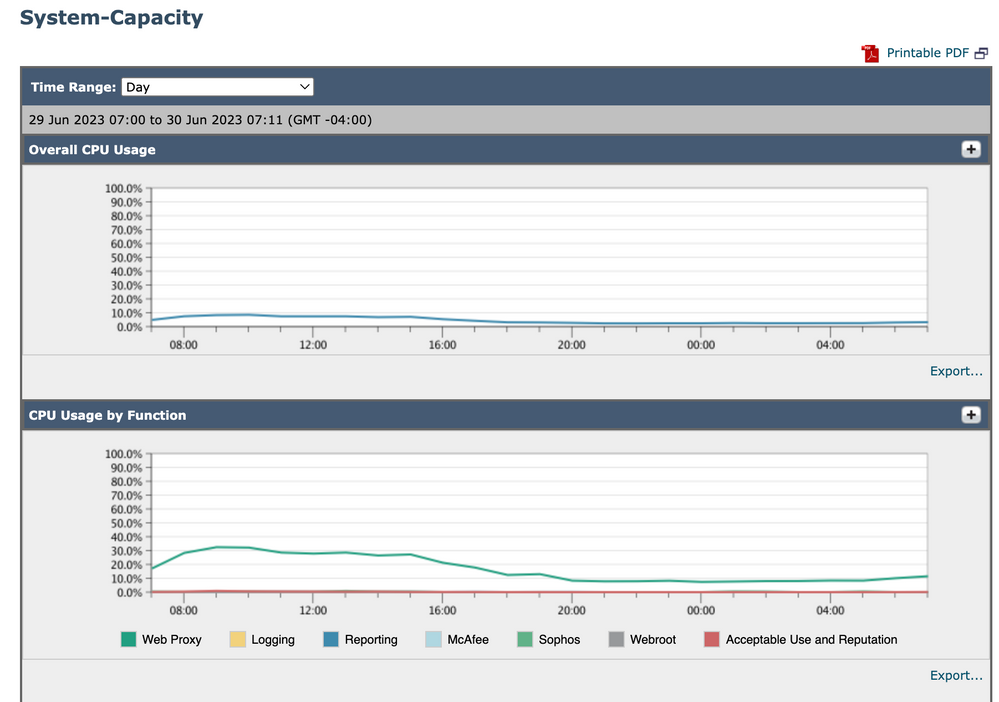
To view process statistics in GUI, navigate to Reporting and choose System Capacity. You can select Time Range to view the resource allocation for desired time stamp.
 Image-System-Capacity
Overall CPU Usage: Shows Total CPU usage
CPU Usage by Function: Shows each sub process, CPU allocation.
Proxy Buffer Memory: Shows the Memory allocation for Proxy Process.

Note: Proxy Buffer Memory is not total Memory Usage of SWA.
CLI Commands
There are multiple CLI commands which shows the main CPU load or sub process status:
status
From the output of status or status detail, you can view the overall CPU usage of SWA, these commands shows the current CPU load.
SWA_CLI)> status

Enter "status detail" for more information.

Status as of:                  Sat Jun 24 06:29:42 2023 EDT
Up since:                      Fri May 05 22:40:40 2023 EDT (49d 7h 49m 2s)
System Resource Utilization:
  CPU                                     3.0%
  RAM                                     9.9%
  Reporting/Logging Disk                 14.4%
Transactions per Second:
  Average in last minute                   101
Bandwidth (Mbps):
  Average in last minute                 4.850
Response Time (ms):
  Average in last minute                   469
Connections:
  Total connections                      12340


SWA_CLI> status detail

Status as of:                  Sat Jun 24 06:29:50 2023 EDT
Up since:                      Fri May 05 22:40:40 2023 EDT (49d 7h 49m 10s)
System Resource Utilization:
  CPU                                     3.5%
  RAM                                     9.8%
  Reporting/Logging Disk                 14.4%
...
rate (proxystat)
rate CLI command, shows the proxy process load, which is a sub process which is the main process in SWA. This command refresh automatically every 15 seconds.
SWA_CLI>  rate

Press Ctrl-C to stop.
  %proxy  reqs                         client    server    %bw  disk  disk
     CPU  /sec   hits blocks misses    kb/sec    kb/sec  saved   wrs   rds
  8.00   116      0    237    928      3801      3794    0.2     6     0
  7.00   110      0    169    932      4293      4287    0.1     2     0

Note: "proxystat" is another CLI command which has the same output as "rate" command
shd_logs
You can view main process status such as Proxy process status, Reporting Process status, and so on,from SHD_Logs. For more information about SHD logs please visit this link:
https://www.cisco.com/c/en/us/support/docs/security/secure-web-appliance/220446-troubleshoot-secure-web-appliance-perfor.html
Here is a sample of shd_logs output:
Sat Jun 24 06:30:29 2023 Info: Status: CPULd 2.9 DskUtil 14.4 RAMUtil 9.8 Reqs 112 Band 22081 Latency 479 CacheHit 0 CliConn 6263 SrvConn 6371 MemBuf 3 SwpPgOut 0 ProxLd 6 Wbrs_WucLd 0.0 LogLd 0.0 RptLd 0.0 WebrootLd 0.0 SophosLd 0.0 McafeeLd 0.0 WTTLd 0.0 AMPLd 0.0

Note: you can access shd_logs from grep or tail CLI command.
process_status
To view Process Status, in versions 14.5 and above, SWA has a new command: process_status which gets process details of SWA.

Note: This command is available only in admin mode.
SWA_CLI> process_status

USER     PID   %CPU %MEM     VSZ     RSS TT  STAT STARTED          TIME COMMAND
root      11 4716.6  0.0       0     768  -  RNL   5May23 3258259:51.69 idle
root   53776   13.0  4.7 6711996 3142700  -  S    14:11       220:18.17 prox
admin  15664    8.0  0.2  123404  104632  0  S+   06:23         0:01.49 cli
admin  28302    8.0  0.2  123404  104300  0  S+   06:23         0:00.00 cli
root      12    4.0  0.0       0    1856  -  WL    5May23    7443:13.37 intr
root   54259    4.0  4.7 6671804 3167844  -  S    14:11       132:20.14 prox
root   91401    4.0  0.2  154524  127156  -  S     5May23    1322:35.88 counterd
root   54226    3.0  4.5 6616892 2997176  -  S    14:11        99:19.79 prox
root    2967    2.0  0.1  100292   80288  -  S     5May23     486:49.36 interface_controlle
root   81330    2.0  0.2  154524  127240  -  S     5May23    1322:28.73 counterd
root      16    1.0  0.0       0      16  -  DL    5May23    9180:31.03 ipmi0: kcs
root   79941    1.0  0.2  156572  103984  -  S     5May23    1844:37.60 counterd
root   80739    1.0  0.1  148380   94416  -  S     5May23    1026:01.89 counterd
root   92676    1.0  0.2  237948  124040  -  S     5May23    2785:37.16 wbnpd
root       0    0.0  0.0       0    1808  -  DLs   5May23      96:10.66 kernel
root       1    0.0  0.0    5428     304  -  SLs   5May23       0:09.44 init
root       2    0.0  0.0       0      16  -  DL    5May23       0:00.00 crypto
root       3    0.0  0.0       0      16  -  DL    5May23       0:00.00 crypto returns
root       4    0.0  0.0       0     160  -  DL    5May23      62:51.56 cam
root       5    0.0  0.0       0      16  -  DL    5May23       0:16.47 mrsas_ocr0
root       6    0.0  0.0       0      16  -  DL    5May23       0:00.52 soaiod1
root       7    0.0  0.0       0      16  -  DL    5May23       0:00.52 soaiod2
root       8    0.0  0.0       0      16  -  DL    5May23       0:00.52 soaiod3
root       9    0.0  0.0       0      16  -  DL    5May23       0:00.52 soaiod4

Note: The CPU utilization of the process; this is a decaying average over up to a minute of previous (real) time. Since the time base over which this is computed varies (since processes could be very young) it is possible for the sum of all %CPU fields to exceed 100%.
%MEM : The percentage of real memory used by this process
VSZ : Virtual size in Kbytes (alias vsize)
RSS : The real memory (resident set) size of the process (in 1024 byte units).
TT : An abbreviation for the path name of the controlling terminal, if any.
STAT
The stat is given by a sequence of characters, for example, "RNL". The first character indicates the run state of the process:
D : Marks a process in disk (or other short term, uninter- ruptible) wait.
I : Marks a process that is idle (sleeping for longer than about 20 seconds).
L : Marks a process that is waiting to acquire a lock.
R : Marks a runnable process.
S : Marks a process that is sleeping for less than about 20 seconds.
T : Marks a stopped process.
W : Marks an idle interrupt thread.
Z : Marks a dead process (a "zombie").
Additional characters after these, if any, indicate additional state information:
+ : The process is in the foreground process group of its control terminal.
< : The process has raised CPU scheduling priority.
C : The process is in capsicum(4) capability mode.
E : The process is trying to exit. J Marks a process which is in jail(2).
L : The process has pages locked in core (for example, for raw I/O).
N : The process has reduced CPU scheduling priority.
s : The process is a session leader.
V : The process' parent is suspended during a vfork(2), waiting for the process to exec or exit.
W : The process is swapped out.
X : The process is being traced or debugged.
TIME : Accumulated CPU time, user + system
Restart Process in SWA
General Process
You can restart SWA serviecs and process from CLI, here are the steps:
Step 1. log in to CLI
Step 2. Type diagnostic

Note: diagnostic is CLI hidden command, so you can not auto-fill the command with TAB.
Step 3. Choose Services
Step 4. Choose the Service/ Process which you want to restart.
Step 5. Choose Restart

Tip: You can view the status of the process from STATUS section.
In this example the WEBUI process which is responcible for GUI has been restarted:
SWA_CLI> diagnostic

Choose the operation you want to perform:
- NET - Network Diagnostic Utility.
- PROXY - Proxy Debugging Utility.
- REPORTING - Reporting Utilities.
- SERVICES - Service Utilities.
[]> SERVICES

Choose one of the following services:
- AMP - Secure Endpoint
- AVC - AVC
- ADC - ADC
- DCA - DCA
- WBRS - WBRS
- EXTFEED - ExtFeed
- L4TM - L4TM
- ANTIVIRUS - Anti-Virus xiServices
- AUTHENTICATION - Authentication Services
- MANAGEMENT - Appliance Management Services
- REPORTING - Reporting Associated services
- MISCSERVICES - Miscellaneous Service
- OCSP - OSCP
- UPDATER - UPDATER
- SICAP - SICAP
- SNMP - SNMP
- SNTP - SNTP
- VMSERVICE - VM Services
- WEBUI - Web GUI
- SMART_LICENSE - Smart Licensing Agent
- WCCP - WCCP
[]> WEBUI

Choose the operation you want to perform:
- RESTART - Restart the service
- STATUS - View status of the service
[]> RESTART

gui is restarting.
Restart Proxy Process
To restart Proxy process which is the main process for proxy, you can use CLI, here are the steps:
Step 1. log in to CLI
Step 2. Type diagnostic

Note: diagnostic is CLI hidden command, so you can not auto-fill the command with TAB.
Step 3. Choose PROXY
Step 4. Type KICK, (it is a hidden command ).
Step 5. Choose Y for yes.
SWA_CLI>diagnostic

Choose the operation you want to perform:
- NET - Network Diagnostic Utility.
- PROXY - Proxy Debugging Utility.
- REPORTING - Reporting Utilities.
- SERVICES - Service Utilities.
[]> PROXY

Choose the operation you want to perform:
- SNAP - Take a snapshot of the proxy
- OFFLINE - Take the proxy offline (via WCCP)
- RESUME - Resume proxy traffic (via WCCP)
- CACHE - Clear proxy cache
- MALLOCSTATS - Detailed malloc stats in the next entry of the track stat log
- PROXYSCANNERMAP - Show mapping between proxy and corresponding scanners
[]> KICK

Kick the proxy?
Are you sure you want to proceed? [N]> Y
Related Information


 Feedback