Configure Advanced Flow Collector Engine Custom Security Event Firing Behavior
Available Languages
Download Options
Bias-Free Language
The documentation set for this product strives to use bias-free language. For the purposes of this documentation set, bias-free is defined as language that does not imply discrimination based on age, disability, gender, racial identity, ethnic identity, sexual orientation, socioeconomic status, and intersectionality. Exceptions may be present in the documentation due to language that is hardcoded in the user interfaces of the product software, language used based on RFP documentation, or language that is used by a referenced third-party product. Learn more about how Cisco is using Inclusive Language.
Contents
Introduction
This document describes two flow collector advanced settings that can alter the way the SNA Flow Collector fires Custom Security Events (CSEs).
Background
The legacy early_check_age flow collector advanced setting, along with the new cse_exec_interval_secs flow collector advanced setting determine the manner in which Custom Security Events are fired by the flow collector engine. The flow collector is the first appliance in the SNA system architecture to see the flow on the network, and thus the flow collector engine is responsible for monitoring the characteristics of the flow(s) while in the flow cache, and determining if the flow meets the configured criteria of a given Custom Security Event. These flow collector advanced settings do NOT however, change the firing characteristics of any of the built in Core Security Events.
Custom Security Event Debugging
In version 7.5.0 and higher of SNA, the debug_custom_events flow collector advanced setting has been enhanced to provide different levels of debugging
- debug_custom_events 1 (least debugging - intended to be able to run in production and provide more insight into exact flows which are generating CSEs)
- debug_custom_events 2 (more debugging)
- debug_custom_events 3 (most verbose debugging)
Default Flow Collector Behavior
By default, the flow collector early_check_age advanced setting is configured to 160 seconds. This means that the flow collector engine waits a minimum of 160 seconds into a flow before it checks to see if that flow matches a configured Custom Security Event. By default, this check is not made again until after the flow ends.
This 160 second early check value was chosen specifically because if using best practices, the telemetry exporters must be configured to send telemetry every 60 seconds. This default value allows for enough time in a typical environment for the flow collector to see flow information related both sides of a given conversation/flow. For this reason, the early_check_age is not pre-defined in the list of advanced settings. This is by design, and you must not alter this value without first consulting with support/engineering. This initial design however does not perform favorably when considering long and somewhat quiet flow characteristics coupled with Custom Security Event configuration that involve the accumulation of byte or packet counts. This was for this reason for the creation of the cse_exec_interval_secs advanced setting parameter .
The cse_exec_interval_secs Advanced Setting
Made available in 7.4.2, the addition of the cse_exec_interval_secs flow collector advanced setting now makes it possible instruct the engine to periodically check the flows in its flow cache against configured Custom Security Events. This advanced setting is particularly useful in the case of long flows, where a given flow has not matched on a CSEs criteria at the default 160 second early_check_age, but crosses that threshold later in the flow. Without this advanced setting, the Custom Security Event would not fire until after the flow ends, sometimes this can be days later.
Performance Impacts
Executing these interval CSE criteria checks on flows more times in the flow’s life than what the defaults define does require more CPU. The instructions guide you through investigating the contents of the sw.log file on the flow collector engine to determine a performance baseline prior to enabling the cse_exec_interval_secs parameter. If you are considering enabling this advanced setting and would like TAC to assist in confirming your flow collector health in preparation for this change, this can be done by opening up a support case and attaching a flow collector diagnostic pack to the SR.
Measuring the duration of the classify_flows thread
One quick performance impact measurement you can do is to investigate sw.log from today and compare the numbers listed after the “cf-“ log entries prior to the activation of the setting to the numbers after the setting is applied.
/lancope/var/sw/today/logs/grep “cf-“ sw.log
20:43:21 I-flo-f0: classify_flows: flows n-1744317 ns-178613 ne-188095 nq-0 nd-0 nx-0 to-300 cf-21 ft-126473/792802/940383/14216
20:44:20 I-flo-f4: classify_flows: flows n-1754296 ns-191100 ne-167913 nq-0 nd-0 nx-0 to-300 cf-20 ft-122830/783378/949392/14928
20:44:21 I-flo-f2: classify_flows: flows n-1773175 ns-191930 ne-169039 nq-0 nd-0 nx-0 to-300 cf-20 ft-123055/788507/962264/15431
20:44:21 I-flo-f3: classify_flows: flows n-1750066 ns-189197 ne-165940 nq-0 nd-0 nx-0 to-300 cf-20 ft-122563/779792/944192/15154
20:44:21 I-flo-f5: classify_flows: flows n-1753899 ns-190477 ne-168004 nq-0 nd-0 nx-0 to-300 cf-20 ft-122261/783375/946651/15423
20:44:21 I-flo-f1: classify_flows: flows n-1763952 ns-191342 ne-169518 nq-0 nd-0 nx-0 to-300 cf-20 ft-122782/786822/955997/15175
20:44:21 I-flo-f7: classify_flows: flows n-1757535 ns-188154 ne-166221 nq-0 nd-0 nx-0 to-300 cf-20 ft-122808/781388/951528/14363
20:44:21 I-flo-f6: classify_flows: flows n-1764211 ns-190964 ne-169013 nq-0 nd-0 nx-0 to-300 cf-21 ft-122713/784446/954149/16320
20:44:21 I-flo-f0: classify_flows: flows n-1764197 ns-189780 ne-168784 nq-0 nd-0 nx-0 to-300 cf-21 ft-123290/787327/952186/14352
20:45:22 I-flo-f4: classify_flows: flows n-1780277 ns-177512 ne-149843 nq-0 nd-0 nx-0 to-300 cf-21 ft-129553/766777/964933/14864
20:45:22 I-flo-f2: classify_flows: flows n-1789285 ns-175763 ne-155809 nq-0 nd-0 nx-0 to-300 cf-21 ft-129685/772482/976850/15289
20:45:22 I-flo-f3: classify_flows: flows n-1774883 ns-177085 ne-149715 nq-0 nd-0 nx-0 to-300 cf-22 ft-129067/764272/962000/15090
20:45:22 I-flo-f5: classify_flows: flows n-1775998 ns-176898 ne-150682 nq-0 nd-0 nx-0 to-300 cf-22 ft-128835/768374/963353/15347
20:45:22 I-flo-f1: classify_flows: flows n-1786441 ns-175776 ne-151846 nq-0 nd-0 nx-0 to-300 cf-22 ft-129255/770212/970360/15129
The cf entries stand for “Classify Flows”. This represents the number of seconds the thread took to make its pass through the section of the Flow Cache that it is responsible for. It is in the “Classify Flows” threads where the CSEs are applied against the flows. If you see these numbers rise after enabling the feature, that is a good measurement of the overall impact on the performance.
A rise after adding this advanced interval setting is expected, but if this number approaches 60, remove the setting as the impact is too great. An increase of a few seconds would be expected and is considered reasonable.
Engine Status Over Performance Period
One other performance “before vs after” measurement you can do is look at the “Performance Period” sections in the sw.log file that are logged every 5 minutes to gauge the impact of the setting on flow processing. You can look for these blocks by using grep as well. If the Engine is overwhelmed, then this advanced setting interval check must be disabled.
/lancope/var/sw/today/logs/ grep -A3 "Performance Period" sw.log
Take notice of any status other than “Engine status Status normal”.
A status such as “Engine status Input rate too high” would indicate that the classify_flows thread is consuming too much CPU.
SFI - Static Flow Index
Means the classify threads were unable to complete their passes through the flow cache: It stands for “Static Flow Index” and it indicates a struggle in the classify flows threads. Its not a disaster by itself, but it indicates that the engine is starting to hit the ceiling and that performance is beginning to degrade at the current cf levels.
sw.log:16:09:49 I-flo-f1: classify_flows: sfi:base(8388608) (10522745 -> 11014427) max(16777215) cod(1) (491681/8388608)---------->(5%)
sw.log:16:09:49 I-flo-f3: classify_flows: sfi:base(25165824) (27269277 -> 27754304) max(33554431) cod(1) (485026/8388608)---------->(5%)
sw.log:16:09:49 I-flo-f4: classify_flows: sfi:base(33554432) (35652656 -> 36138422) max(41943039) cod(1) (485765/8388608)---------->(5%)
sw.log:16:09:49 I-flo-f2: classify_flows: sfi:base(16777216) (18985626 -> 19499308) max(25165823) cod(1) (513681/8388608)---------->(6%)
sw.log:16:09:54 I-flo-f0: classify_flows: sfi:base(0) (1786480 -> 421161) max(8388607) cod(1) (7023288/8388608)---------->(83%)
sw.log:16:10:49 I-flo-f0: classify_flows: sfi:base(0) (421161 -> 1402189) max(8388607) cod(0) (981027/8388608)---------->(11%)
sw.log:16:10:49 I-flo-f2: classify_flows: sfi:base(16777216) (19499308 -> 17522620) max(25165823) cod(0) (6411919/8388608)---------->(76%)
sw.log:16:10:49 I-flo-f1: classify_flows: sfi:base(8388608) (11014427 -> 8976309) max(16777215) cod(0) (6350489/8388608)---------->(75%)
sw.log:16:10:49 I-flo-f3: classify_flows: sfi:base(25165824) (27754304 -> 25702968) max(33554431) cod(0) (6337271/8388608)---------->(75%)
sw.log:16:10:49 I-flo-f7: classify_flows: sfi:base(58720256) (58848913 -> 59630528) max(67108863) cod(0) (781614/8388608)---------->(9%)
sw.log:16:10:49 I-flo-f4: classify_flows: sfi:base(33554432) (36138422 -> 34064015) max(41943039) cod(1) (6314200/8388608)---------->(75%)
sw.log:16:10:49 I-flo-f5: classify_flows: sfi:base(41943040) (43310891 -> 44059251) max(50331647) cod(1) (748359/8388608)---------->(8%)
sw.log:16:10:49 I-flo-f6: classify_flows: sfi:base(50331648) (51714170 -> 52444661) max(58720255) cod(1) (730490/8388608)---------->(8%)
sw.log:16:11:49 I-flo-f5: classify_flows: sfi:base(41943040) (44059251 -> 42121104) max(50331647) cod(0) (6450460/8388608)---------->(76%)
sw.log:16:11:49 I-flo-f0: classify_flows: sfi:base(0) (1402189 -> 2373792) max(8388607) cod(1) (971602/8388608)---------->(11%)
sw.log:16:11:49 I-flo-f6: classify_flows: sfi:base(50331648) (52444661 -> 50483491) max(58720255) cod(1) (6427437/8388608)---------->(76%)
sw.log:16:11:49 I-flo-f3: classify_flows: sfi:base(25165824) (25702968 -> 26385879) max(33554431) cod(1) (682910/8388608)---------->(8%)
sw.log:16:11:49 I-flo-f1: classify_flows: sfi:base(8388608) (8976309 -> 9662167) max(16777215) cod(1) (685857/8388608)---------->(8%)
sw.log:16:11:49 I-flo-f4: classify_flows: sfi:base(33554432) (34064015 -> 34742593) max(41943039) cod(1) (678577/8388608)---------->(8%)
sw.log:16:11:50 I-flo-f7: classify_flows: sfi:base(58720256) (59630528 -> 60298366) max(67108863) cod(1) (667837/8388608)---------->(7%)
sw.log:16:11:50 I-flo-f2: classify_flows: sfi:base(16777216) (17522620 -> 18202249) max(25165823) cod(1) (679628/8388608)---------->(8%)
Configuring
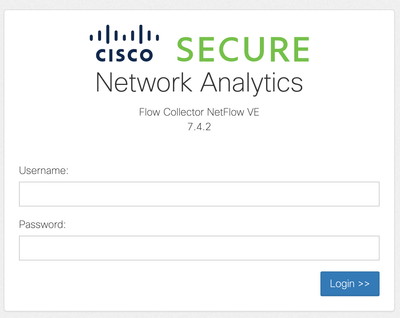
Open a web browser and navigate to the Flow Collector appliance IP directly. Login as the local admin user.
Navigate to Support -> Advanced Settings
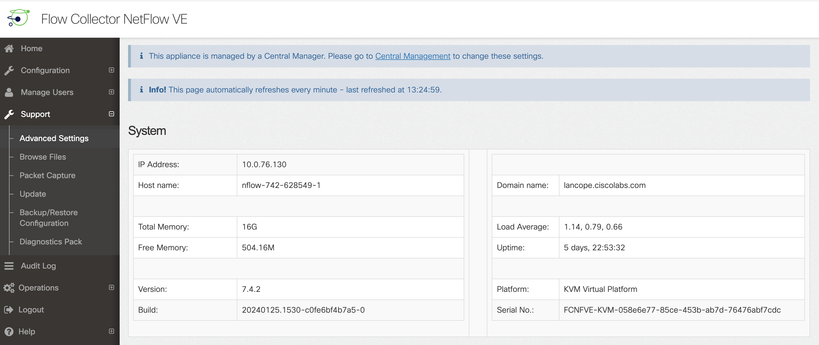
Scroll down the Advanced Setting screen to expose the "Add New Option" configuration box at the bottom of the list

In the Add New Option: edit box enter cse_exec_interval_secs and in the Option value: edit box enter 119. Editing these boxes enables the Add button. Press the Add button after entering cse_exec_interval_secs into the Add New Option: edit box and 119 in the Option Value: edit box.

The Add New Option: and Option value: edit boxes clear out in preparation for another entry in the event multiple new Advanced Settings are going to be entered. The newly added Advanced Settings are tacked onto the bottom of the list as they are being added. This gives the user a chance to inspect the entry. Exact spelling of the Advanced Setting is important as well as the case. All Advanced Settings are in lowercase.

Now that the Advanced Setting is entered properly, press the Apply button. Note that sometimes the Apply button is not enabled. To enable it, click into the Add New Option: edit box and then the Apply button becomes enabled for clicking. When presented with this pop-up, press the OK button to submit the new Advanced Setting and value.
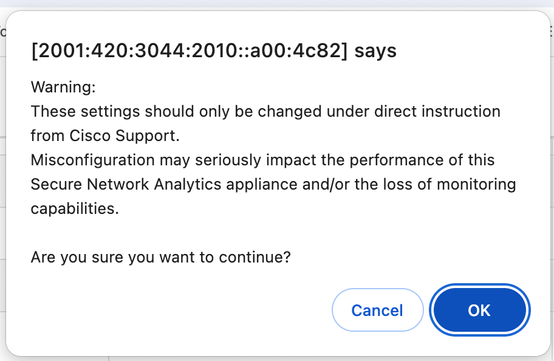
Confirming the Change
This final validation is the most important. Click on the Support menu again and choose Browse Files.
This takes you to the file system on the FC. Click on sw.
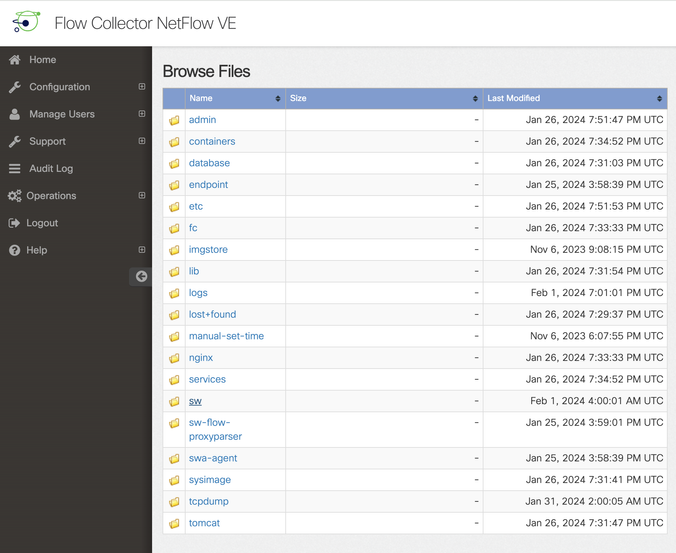
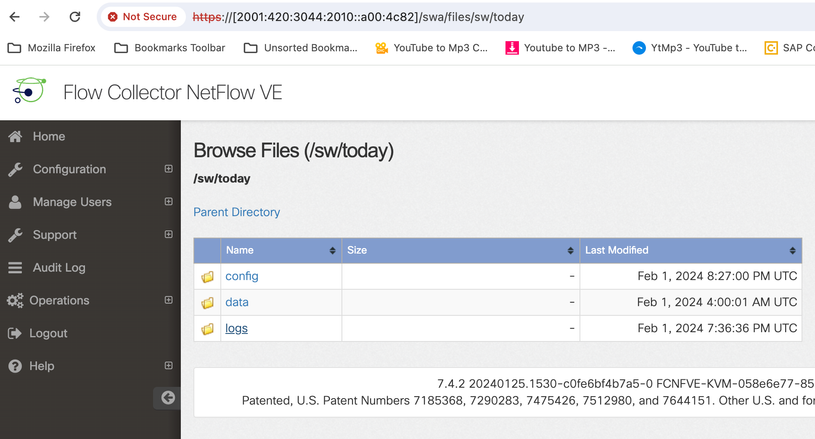
Click on today
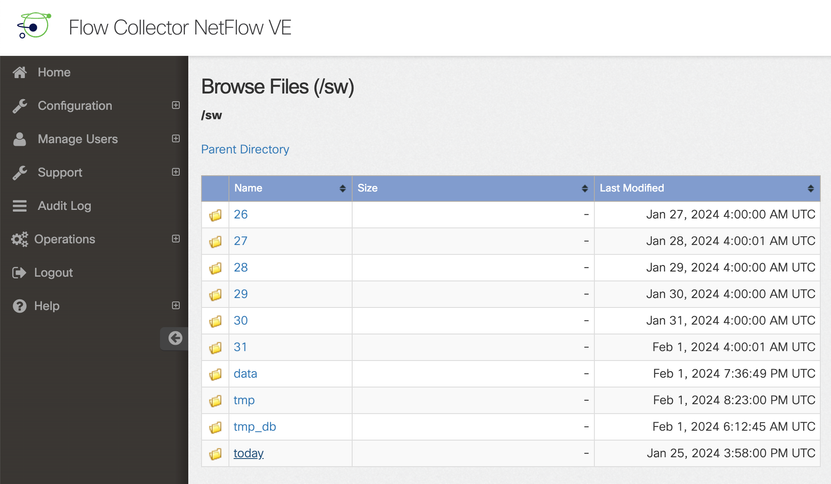
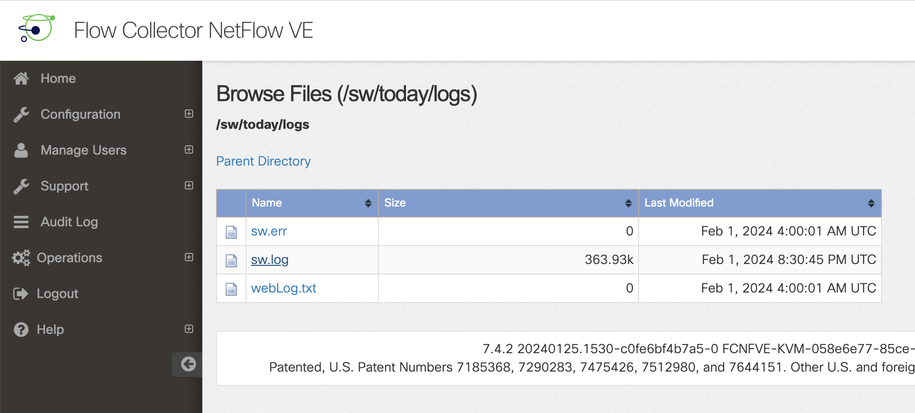
Click on logs.
Click on sw.log
Perform a search in the browser page, Enter cse_exec_interval_secs into the search box to find the Advanced Setting
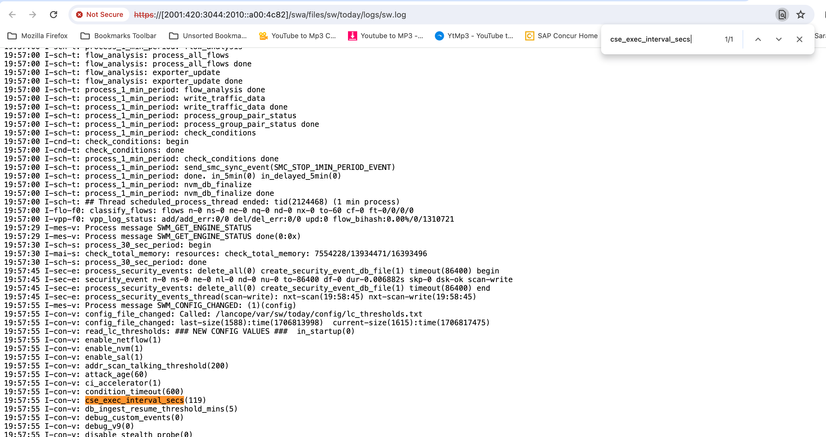
Accepted Advanced Settings are listed as shown in the screenshot.
The ones not accepted are listed as shown as "not part of input configuration", in this case it was due to the user misspelling the setting. This is why its important to check the log after making such configuration changes.

Congratulations!
You have just entered a new Advanced Setting and validated its acceptance by the engine.
Now, the feature is enabled to run the CSE logic on the flows approximately every 2 minutes after the flow reaches the early_check_age which defaults to 160 seconds.
If the CSE rules involve accumulating byte counts over time, this feature improves the timing at which the CSEs trigger on flows that match the criteria you have defined.
Revision History
| Revision | Publish Date | Comments |
|---|---|---|
1.0 |
29-Mar-2024 |
Initial Release |
Contributed by Cisco Engineers
- Kevin BartolettaTAC Technical Leader
- Danny LlewallynEngineering Technical Leader
- Matthew RobbinsTAC Team Lead
Contact Cisco
- Open a Support Case

- (Requires a Cisco Service Contract)
 Feedback