ASA 8.2: Configure Syslog using ASDM
Available Languages
Contents
Introduction
This document provides information on how to configure syslog on the Cisco Adaptive Security Appliance (ASA) 8.x by using the Adaptive Security Device Manager (ASDM) GUI. System log messages are the messages generated by the Cisco ASA to notify the administrator on any change in the configuration, changes in network setup, or changes in the performance of the device. By analyzing the system log messages, an administrator can easily troubleshoot the error by performing a root cause analysis.
Syslog messages are mainly differentiated based on their severity level.
-
Severity 0 - Emergency Messages - Resource is unusable
-
Severity 1 - Alert Messages - Immediate action is needed
-
Severity 2 - Critical Messages - Critical conditions
-
Severity 3 - Error Messages - Error conditions
-
Severity 4 - Warning Messages - Warning conditions
-
Severity 5 - Notification Messages - Normal but significant conditions
-
Severity 6 - Informational Messages - Informational messages only
-
Severity 7 - Debugging Messages - Debugging messages only
Note: The highest severity level is an emergency and the lowest severity level is debugging.
Sample syslog messages generated by the Cisco ASA are shown here:
-
%ASA-6-106012: Deny IP from IP_address to IP_address, IP options hex.
-
%ASA-3-211001: Memory allocation Error
-
%ASA-5-335003: NAC Default ACL applied, ACL:ACL-name - host-address
The numeric value X specified in "%ASA-X-YYYYYY:", denotes the severity of the message. For example, "%ASA-6-106012" is an Informational message and "%ASA-5-335003" is an Error message.
Prerequisites
Requirements
There are no specific requirements for this document.
Components Used
The information in this document is based on these software and hardware versions:
-
Cisco ASA Version 8.2
-
Cisco ASDM Version 6.2
The information in this document was created from the devices in a specific lab environment. All of the devices used in this document started with a cleared (default) configuration. If your network is live, make sure that you understand the potential impact of any command.
Conventions
Refer to the Cisco Technical Tips Conventions for more information on document conventions.
Basic Syslog Configuration by using ASDM
Enable Logging
Complete these steps:
-
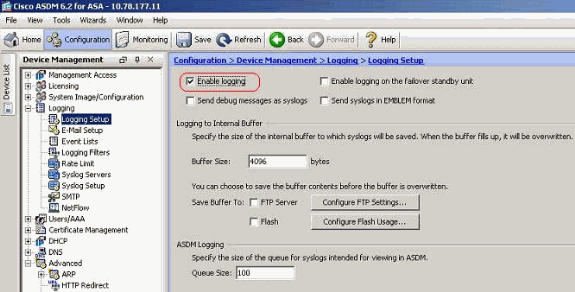
Choose Configuration > Device Management > Logging > Logging Setup and check mark the Enable logging option.
-
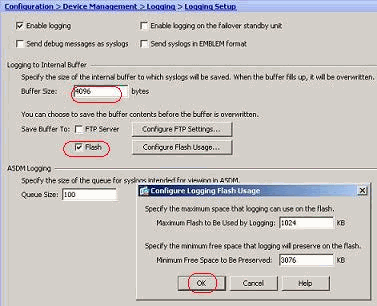
You can log the syslog messages to an internal buffer by specifying the buffer size. You can also choose to save the buffer contents to Flash memory by clicking Configure Flash Usage and defining the Flash settings.
-
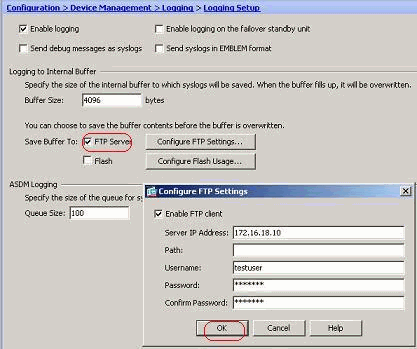
Buffered log messages can be sent to an FTP server before they are overwritten. Click Configure FTP Settings and specify the FTP server details as shown here:
Disable Logging
You can disable specific syslog IDs based on your requirement.
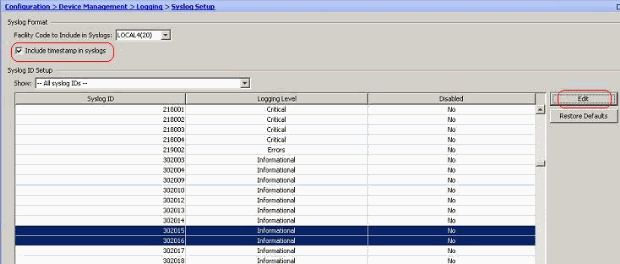
Note: By selecting the check mark for the Include timestamp in syslogs option, you can add the date and time that they were generated as a field to the syslogs.
-
Select the syslogs to disable and click Edit.
-
From the Edit Syslog ID Settings window, check mark the Disable messages option and click OK.
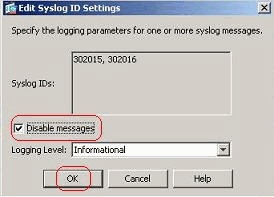
-
The disabled syslogs can be viewed in a separate tab by selecting Disabled syslog IDs from the Syslog ID Setup drop-down menu.

Logging to an e-mail
Complete these steps using ASDM in order to send the syslogs to an e-mail:
-
Choose Configuration > Device Management > Logging > E-Mail Setup. The Source E-Mail Address field is helpful in assigning an e-mail ID as the source for the syslogs. Specify the source e-mail address. Now, click Add to add the e-mail recipients.

-
Specify the Destination E-mail Address and choose the Severity level. Based on the severity levels, you can define different e-mail recipients. Click OK to return back to the E-Mail Setup pane.
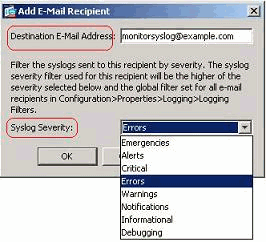
This results in this configuration:

-
Choose Configuration > Device Setup > Logging > SMTP and specify the SMTP server.

Logging to a Syslog Server
You can send all the syslog messages to a dedicated syslog server. Perform these steps by using ASDM:
-
Choose Configuration > Device Management > Logging > Syslog Servers and click Add to add a syslog server.

The Add Syslog Server window appears.
-
Specify the interface that the server is associated with along with the IP address. Specify the Protocol and Port details depending on your network setup. Then, click OK.
Note: Make sure that you have reachability to the syslog server from the Cisco ASA.
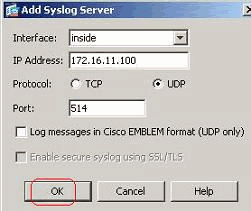
-
The configured syslog server is seen as shown here. Modifications can be done when you select this server, then click Edit.
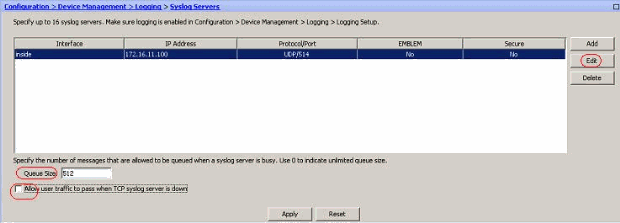
Note: Check mark the Allow user traffic to pass when TCP syslog server is down option. Otherwise, the new user sessions are denied through the ASA. This is applicable only when the transport protocol between the ASA and the syslog server is TCP. By default, new network access sessions are denied by the Cisco ASA when a syslog server is down for any reason.
In order to define the type of syslog messages that are to be sent to the syslog server, see the Logging Filter section.
Advanced Syslog Configuration by using ASDM
Working with Event Lists
Event lists enable us to create customized lists that contain the group of syslog messages that are to be sent to a destination. Event lists can be created in three different ways:
-
Message ID or Range of message IDs
-
Message Severity
-
Message Class
Message ID or Range of message IDs
Perform these steps:
-
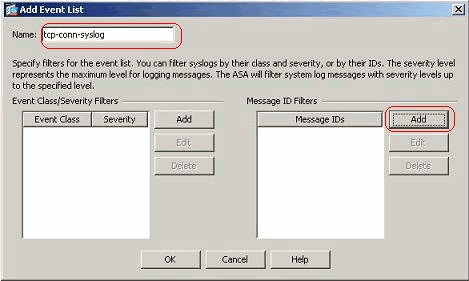
Choose Configuration > Device Management > Logging > Event Lists and click Add to create a new event list.

-
Specify a name in the Name field. Click Add in the Message ID Filters pane to create a new event list.
-
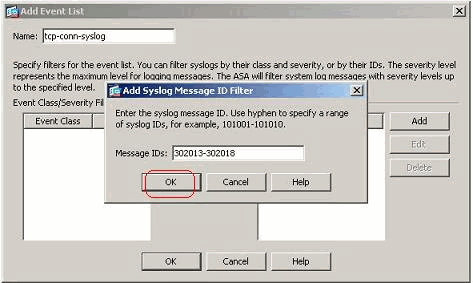
Specify the range of syslog message IDs. Here the TCP syslog messages have taken for example. Click OK to complete.
-
Click OK again in order to revert back to the Event Lists window.

Message Severity
-
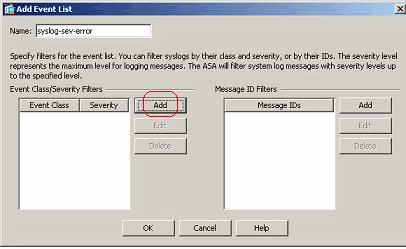
Event lists can also be defined based on the message severity. Click Add to create a separate event list.

-
Specify the name and click Add.
-
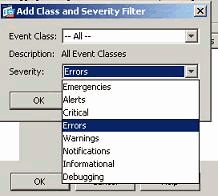
Select the severity level as Errors.
-
Click OK.

Message Class
Event lists are also configured based on the Message Class. A message class is a group of syslog messages related to a security appliance feature that enables you to specify an entire class of messages instead of specifying a class for each message individually. For example, use the auth class to select all syslog messages that are related to user authentication. Some available messages classes are shown here:
-
All—All event classes
-
auth—User Authentication
-
bridge—Transparent firewall
-
ca—PKI Certification Authority
-
config—Command Interface
-
ha—Failover
-
ips—Intrusion Protection Service
-
ip—IP Stack
-
np—Network Processor
-
ospf—OSPF Routing
-
rip—RIP Routing
-
session—User Session
Perform these steps to create an event class based on the vpnclient-errors message class. The message class, vpnc, is available to categorize all syslog messages related to the vpnclient. Severity level for this message class is chosen as "errors".
-
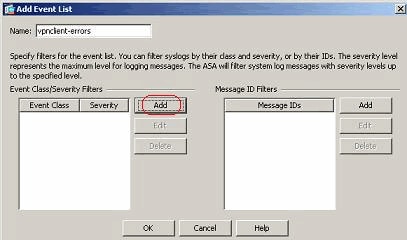
Click Add to create a new event list.

-
Specify the name to be relevant to the message class you create and click Add.
-
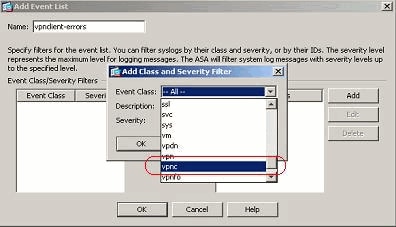
Select vpnc from the drop-down list.
-
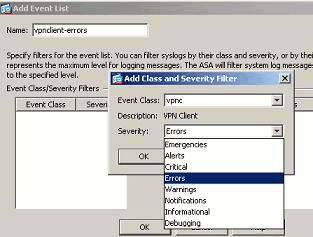
Select the severity level as Errors. This severity level is applicable for those messages that are logged for this message class only. Click OK to revert back to the Add Event List window.
-
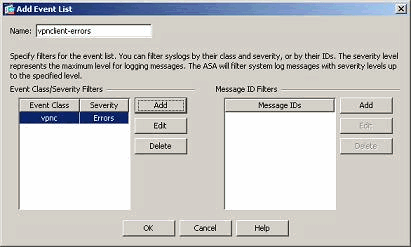
The event class/severity is shown here. Click OK to complete configuring the "vpnclient-errors" event list.
It is also shown in the next screenshot that a new event list, "user-auth-syslog", is created with a message class as "auth" and the severity level for the syslogs of this specific message class as "Warnings". By configuring this, the event list specifies all the syslog messages that are related to the "auth" message class, with severity levels up to "Warnings" level.
Note: Here, the term "up to" is of significance. When denoting the severity level, keep in mind that all the syslog messages will be logged until that level.
Note: An event list can contain multiple event classes. The "vpnclient-errors" event list is modified by clicking Edit and defining a new event class "ssl/error".

Working with Logging Filters
Logging filters are used to send the syslog messages to a specified destination. These syslog messages can be based on the "Severity" or the "Even Lists".
These are the types of destinations to which these filters are applicable:
-
Internal Buffer
-
SNMP Trap
-
E-Mail
-
Console
-
Telnet Sessions
-
ASDM
-
Syslog Servers
Perform these steps:
-
Choose Configuration > Device Management > Logging > Logging Filters and select the logging destination. Then, click Edit to modify the settings.

-
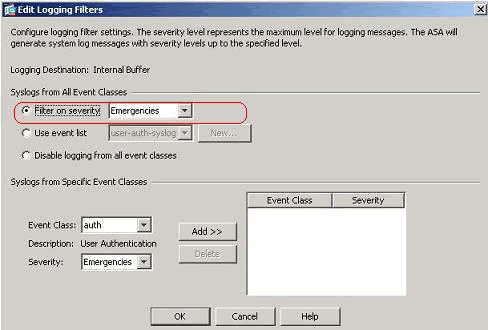
You can send the syslog messages based on the severity. Here, Emergencies has been selected to show as an example.
-
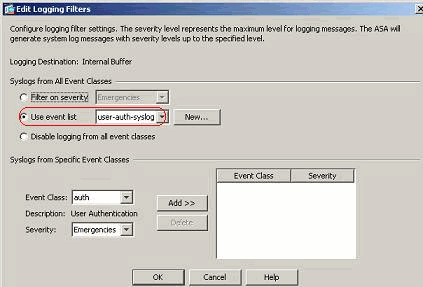
An event list can also be selected to specify which type of messages are to be sent to a particular destination. Click OK.
-
Verify the modification.

These are the steps on how to send a group of messages (based on their severity level) to the E-mail server.
-
Select E-mail in the Logging Destination field. Then, click Edit.

-
Choose the Filter on severity option and select the required severity level.
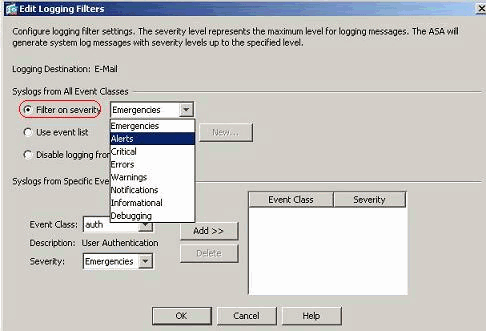
Here, Alerts has been selected as the severity level.

You can see that all Alert syslog messages are to be sent to the E-mail configured.

Rate Limit
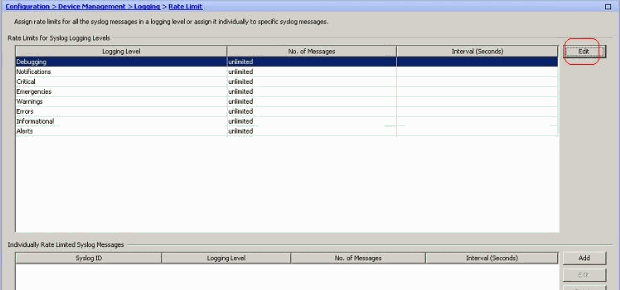
This specifies the number of syslog messages that a Cisco ASA sends to a destination in a specified time period. It is usually defined for the severity level.
-
Choose Configuration > Device Management > Logging > Rate Limit and select the required severity level. Then, click Edit.
-
Specify the Number of Messages to be sent along with the Time Interval. Click OK.
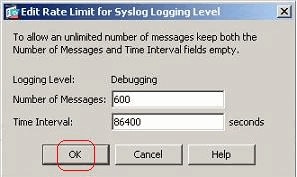
Note: These numbers are given as an example. These differ depending on the type of network environment.
Modified values are seen here:

Logging the Hits of an Access Rule
You can log the access rule hits using the ASDM. The default logging behavior is to send a syslog message for all the denied packets. There will not be any syslog message for the permitted packets and these will not be logged. However, you can define a custom logging severity level to the access rule to track the count of the packets that hits this access rule.
Perform these steps:
-
Select the required access rule and click Edit.
The Edit the Access Rule window appears.
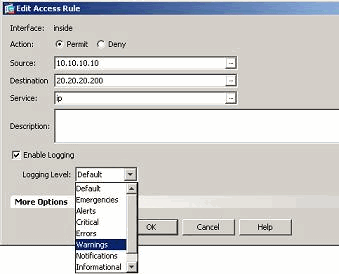
Note: In this image, the Default option in the Logging Level field indicates the default logging behavior of the Cisco ASA. For more information about this, refer to the Logging Access List Activity section.
-
Check mark the Enable logging option and specify the required severity level. Then, click OK.
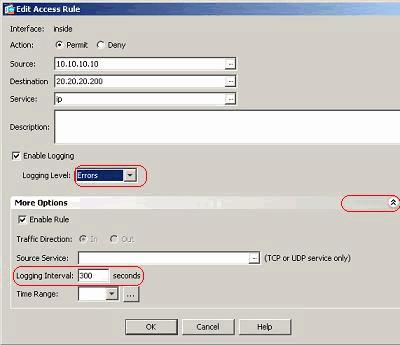
Note: By clicking the More options drop-down tab, you can see the Logging Interval option. This option is highlighted only when the above Enable Logging option is ticked. Default value of this timer is 300 seconds. This setting is useful in specifying the time-out value for the flow-statistics to be deleted when there is no match for that access rule. If there are any hits, then ASA waits until the Logging Interval time and sends that to the syslog.
-
The modifications are shown here. Alternatively, you can double-click the Logging field of the specific access rule and set the severity level there.
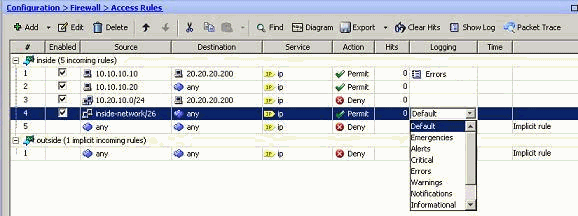
Note: This alternate method of specifying the Logging Level in the same Access Rules pane by double-clicking does work for only manually created access rule entries, but not to the Implicit Rules.
Configure
In this section, you are presented with the information to configure the features described in this document.
Note: Use the Command Lookup Tool (registered customers only) to obtain more information on the commands used in this section.
Configurations
This document uses these configurations:
| CiscoASA |
|---|
: Saved : ASA Version 8.2(1) ! hostname ciscoasa enable password 8Ry2YjIyt7RRXU24 encrypted passwd 2KFQnbNIdI.2KYOU encrypted names ! interface Ethernet0/0 shutdown no nameif no security-level no ip address ! interface Ethernet0/1 nameif outside security-level 0 ip address 209.165.201.2 255.255.255.0 ! interface Ethernet0/2 nameif inside security-level 100 ip address 10.78.177.11 255.255.255.192 ! ! !--- Output Suppressed ! access-list inside_access_in extended permit ip host 10.10.10.10 host 20.20.20.200 log errors access-list inside_access_in extended permit ip host 10.10.10.20 any access-list inside_access_in extended deny ip 10.20.10.0 255.255.255.0 host 20.20.20.200 access-list inside_access_in extended permit ip 10.78.177.0 255.255.255.192 any log emergencies pager lines 24 logging enable logging list user-auth-syslog level warnings class auth logging list TCP-conn-syslog message 302013-302018 logging list syslog-sev-error level errors logging list vpnclient-errors level errors class vpnc logging list vpnclient-errors level errors class ssl logging buffered user-auth-syslog logging mail alerts logging from-address test123@example.com logging recipient-address monitorsyslog@example.com level errors logging queue 1024 logging host inside 172.16.11.100 logging ftp-bufferwrap logging ftp-server 172.16.18.10 syslog testuser **** logging permit-hostdown no logging message 302015 no logging message 302016 logging rate-limit 600 86400 level 7 mtu outside 1500 mtu inside 1500 icmp unreachable rate-limit 1 burst-size 1 asdm image disk0:/asdm-623.bin asdm history enable arp timeout 14400 ! !--- Output Suppressed ! timeout xlate 3:00:00 timeout conn 1:00:00 half-closed 0:10:00 udp 0:02:00 icmp 0:00:02 timeout sunrpc 0:10:00 h323 0:05:00 h225 1:00:00 mgcp 0:05:00 mgcp-pat 0:05:00 timeout sip 0:30:00 sip_media 0:02:00 sip-invite 0:03:00 sip-disconnect 0:02:00 timeout sip-provisional-media 0:02:00 uauth 0:05:00 absolute timeout TCP-proxy-reassembly 0:01:00 dynamic-access-policy-record DfltAccessPolicy ! !--- Output Suppressed ! ! telnet timeout 5 ssh timeout 5 console timeout 0 threat-detection basic-threat threat-detection statistics access-list no threat-detection statistics TCP-intercept ! !--- Output Suppressed ! username test password /FzQ9W6s1KjC0YQ7 encrypted privilege 15 ! ! class-map inspection_default match default-inspection-traffic ! ! policy-map type inspect dns preset_dns_map parameters message-length maximum 512 policy-map global_policy class inspection_default inspect dns preset_dns_map inspect ftp inspect h323 h225 inspect h323 ras inspect netbios inspect rsh inspect rtsp inspect skinny inspect esmtp inspect sqlnet inspect sunrpc inspect tftp inspect sip inspect xdmcp ! service-policy global_policy global smtp-server 172.18.10.20 prompt hostname context Cryptochecksum:ad941fe5a2bbea3d477c03521e931cf4 : end |
Verify
Use this section to confirm that your configuration works properly.
The Output Interpreter Tool (registered customers only) (OIT) supports certain show commands. Use the OIT to view an analysis of show command output.
-
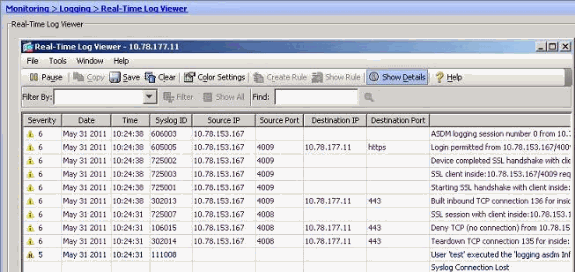
You can view the syslogs from the ASDM. Choose Monitoring > Logging > Real Time Log Viewer. A sample output is shown here:
Troubleshoot
Problem: Connection Lost -- Syslog Connection Terminated --
This error is received when attempting to enable ASDM logging at the Device Dashboard for any of the contexts.
"Connection Lost -- Syslog Connection Terminated --"
When ASDM is used to connect directly to the admin context and ADSM logging is disabled there, then switch to a subcontext and enable ASDM logging. The errors are received, but the syslog messages are reaching fine to the syslog server.
Solution
This is a known behavior with Cisco ASDM and documented in Cisco bug ID CSCsd10699 (registered customers only) . As a workaround, enable asdm logging when logged into admin context.
Cannot View the Real Time Logs on Cisco ASDM
An issue is that the real time logs cannot be viewed on ASDM. How is this configured?
Solution
Configure the following on the Cisco ASA:
ciscoasa(config)#logging monitor 6
ciscoasa(config)#terminal monitor
ciscoasa(config)#logging on
ciscoasa(config)#logging trap 6
Related Information
Revision History
| Revision | Publish Date | Comments |
|---|---|---|
1.0 |
13-Jun-2011 |
Initial Release |
Contact Cisco
- Open a Support Case

- (Requires a Cisco Service Contract)


 Feedback