Introduction
This document describes how to generate diagnostic data for the Cisco Secure Endpoint Linux connector.
Background Information
The Cisco Secure Endpoint Linux connector comes packaged with the Support Tool application, which is used in order to generate diagnostic data about the endpoint and the connector that is installed on it. The diagnostic data includes information such as:
- Resource utilization (disk, CPU, and memory).
- Connector-specific logs.
- Connector configuration information.
Generate Diagnostic Data
Diagnostic data can be generated via two different methods:
- Locally using the Support Tool.
- Remotely using the Secure Endpoint Console.
The generated diagnostic data can be provided to the Cisco Technical Assistance Center (TAC) for further analysis.
Generate Diagnostic Data Locally Using the Support Tool
Run the following command to generate diagnostic data for the Linux connector using the Support Tool:
sudo /opt/cisco/amp/bin/ampsupport

Note: You must have sufficient privileges to run the Support Tool, so ensure that you preface the command with sudo.
The Support Tool creates a .zip archive file called AMP_Support_<timestamp>.zip at the current logged in user's Desktop directory if it exists, otherwise the archive file will be created at the current logged in user's home directory.
Generate Diagnostic Data Using the Secure Endpoint Console
Complete these steps to generate diagnostic data for the Linux connector through the Secure Endpoint Console:
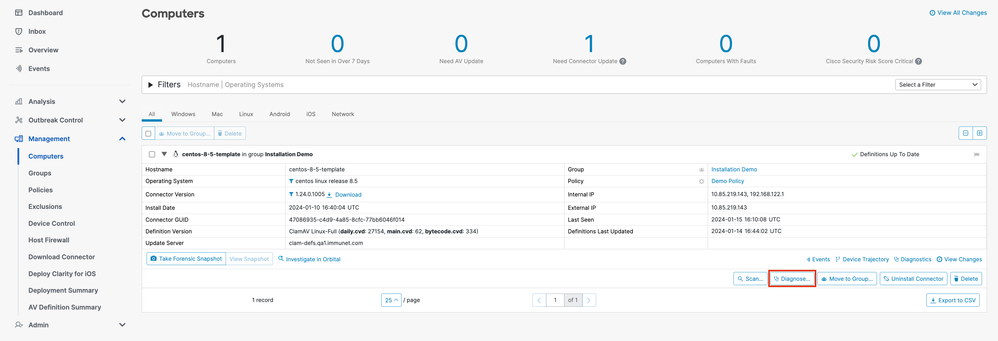
- Navigate to the Computers page by selecting
Management -> Computers and identify your computer in the list. Click Diagnose....
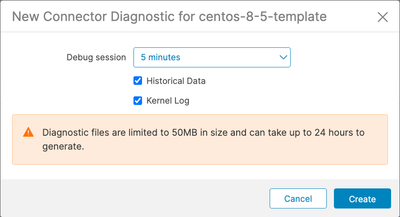
- In the New Connector Diagnostic popup, select the length of the Debug session from the dropdown and ensure the checkboxes for Historical Data and Kernel Log are both selected. Click
Create.
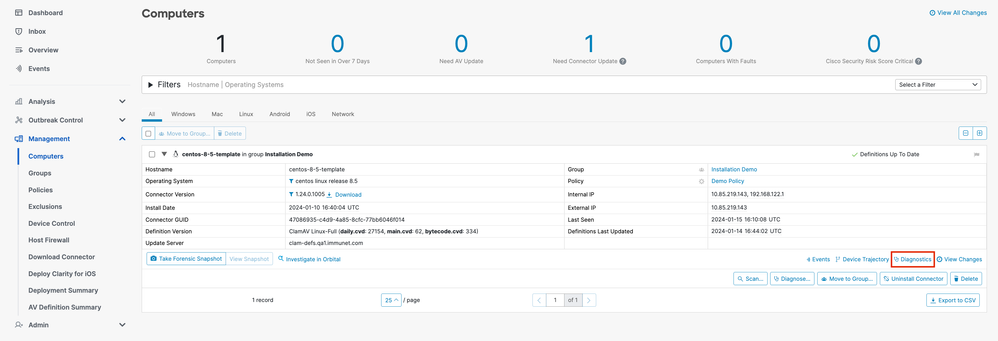
- Still on the Computers page, click
Diagnostics for your connector. You will be brought to the File Repository page in the Analysis section.
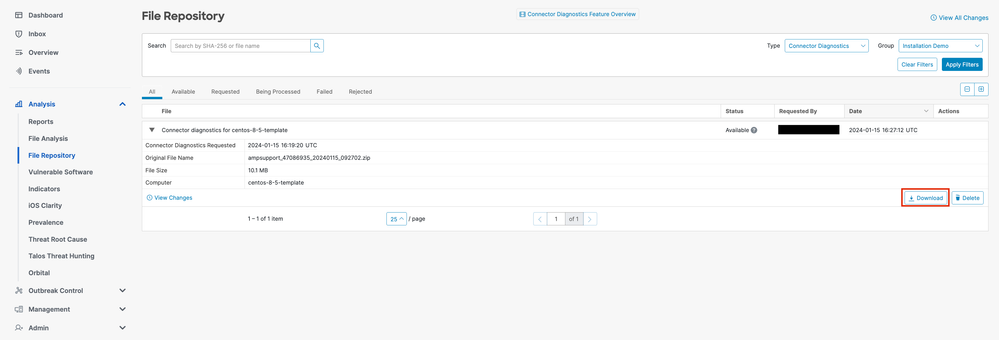
- On the File Repository page, you can view the statuses of requested diagnostics. Locate the diagnostics for your computer using the filters. When your diagnostic has the "Available" status, click
Download.

Note: You will also receive an email from Cisco Secure Endpoint when the requested diagnostic data is available for download.
Troubleshooting
Debug mode logging can be enabled for the Secure Endpoint Linux connector to provide more detailed troubleshooting information in the diagnostic data. Debug mode can be enabled/disabled remotely using the Secure Endpoint Console or locally using the Linux connector's command line tool.

Warning: Debug mode should be enabled only if a Cisco Technical Support Engineer makes a request for this data. If you keep Debug mode enabled for an extended period of time, it can fill up the disk space very quickly and might prevent the connector Log and Tray Log data from being gathered in the Support Diagnostic file due to excessive file size.
Enable Debug Mode
Enable Debug Mode Using the Secure Endpoint Console
Complete these steps in order to enable Debug mode and collect diagnostic data using the Secure Endpoint Console:
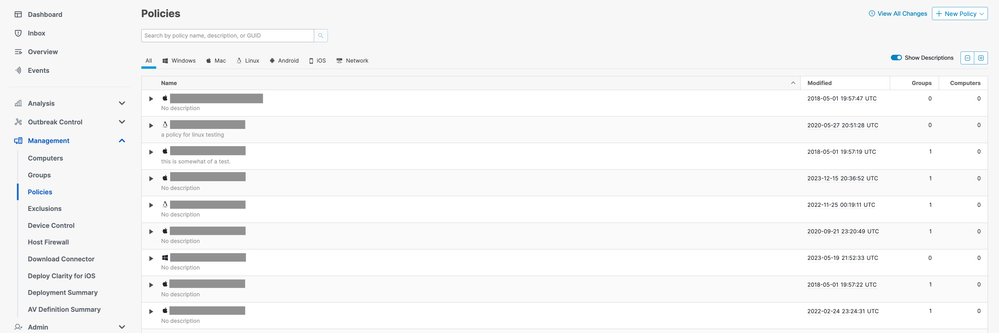
- In the Secure Endpoint Console, navigate to the Policies page by selecting
Management -> Policies.
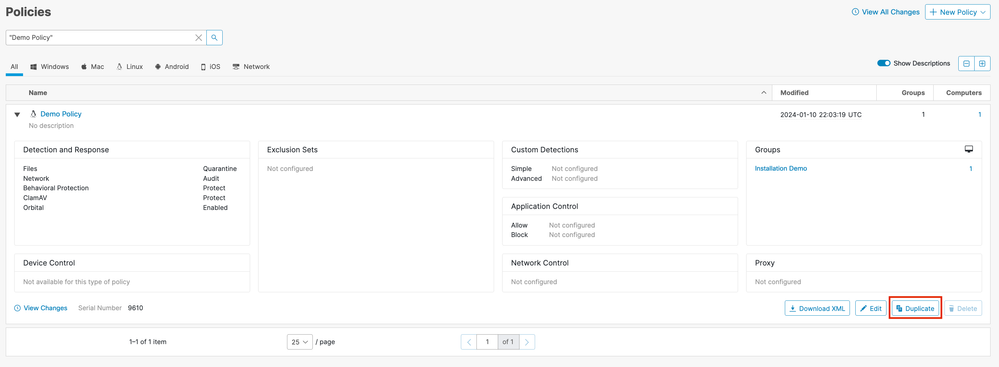
- Locate and select the policy that is applied to the endpoint, this will expand the Policy window. Click
Duplicate.
- The Secure Endpoint Console will create a copy of the requested policy.
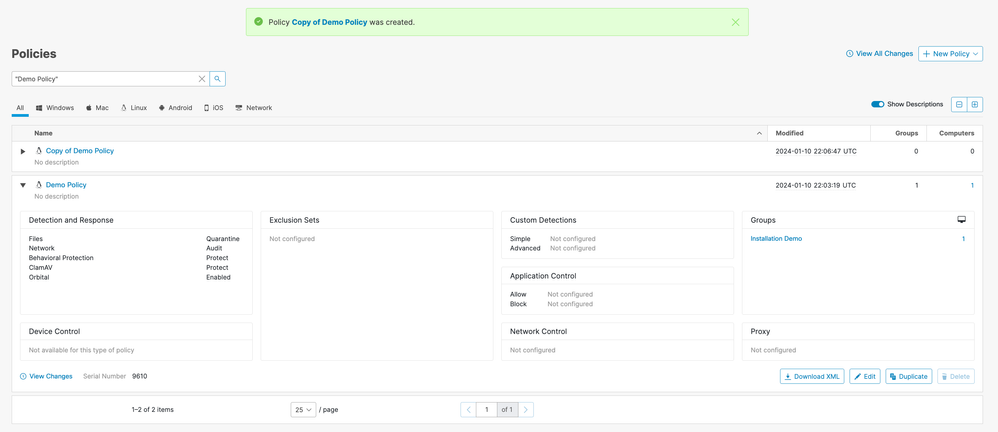
- Select and expand the duplicate policy and click
Edit. You will be brought to the Edit Policy page for that policy.

- Change the name of the policy. For example, you could use Debug TechZone Linux Policy.
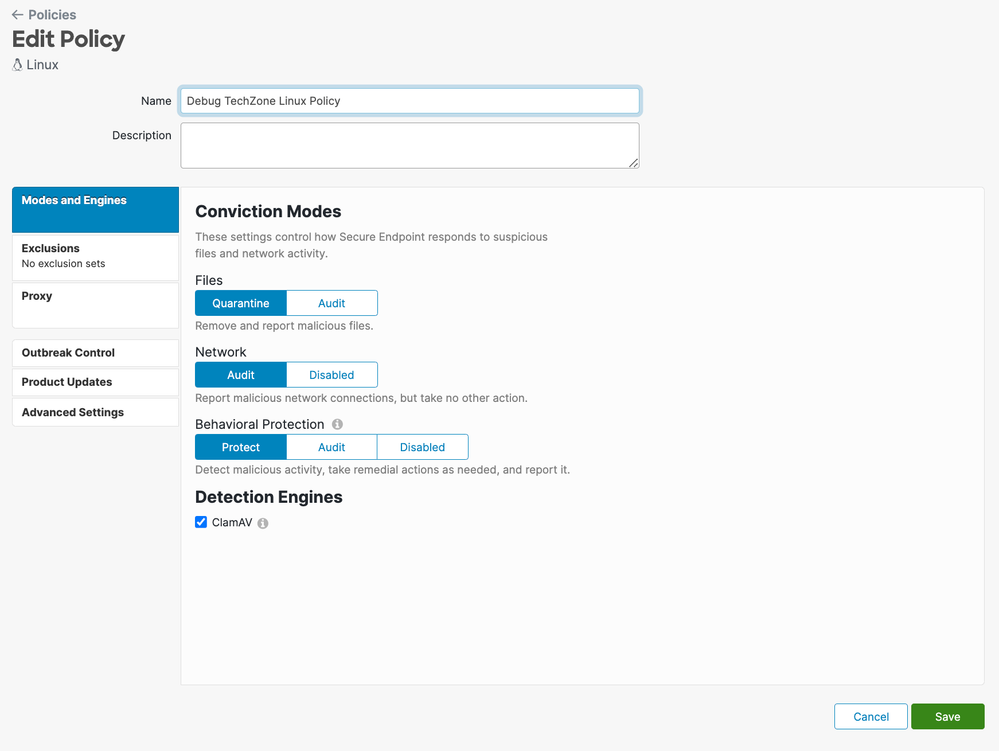
- Select
Advanced Settings, and select Administrative Features from the sidebar.
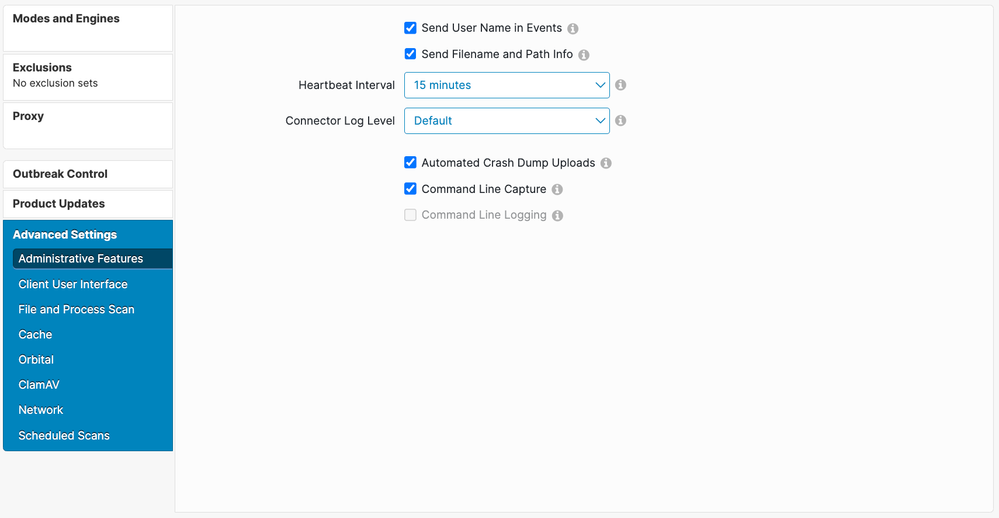
- Expand the Connector Log Level dropdown and click "Debug".
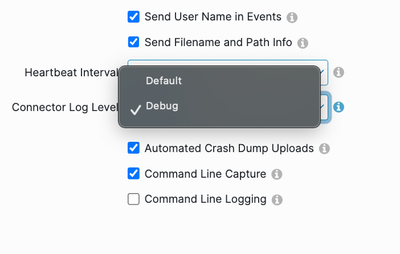
- Click
Save in order to save the changes.
- Navigate to the Groups page by selecting
Management -> Groups and click Create Group. You will be brought to the New Group page.
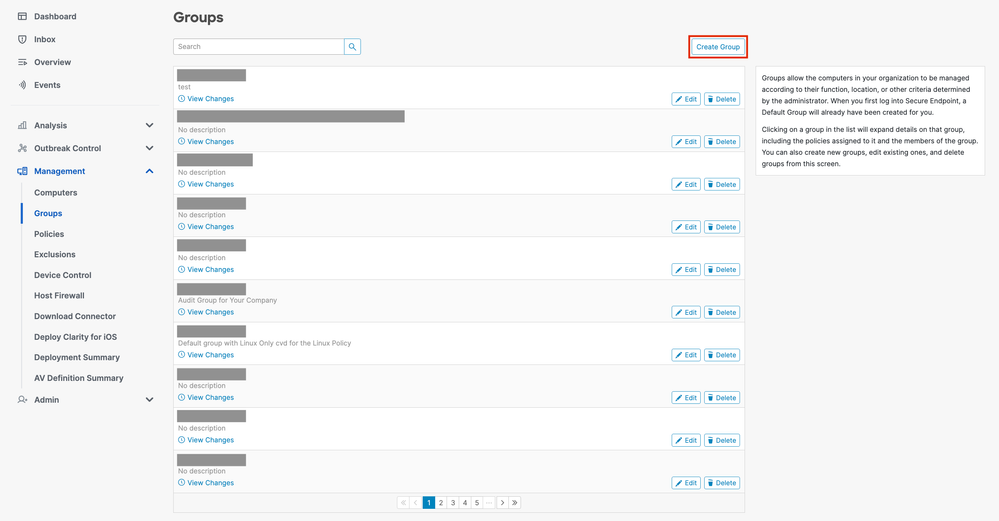
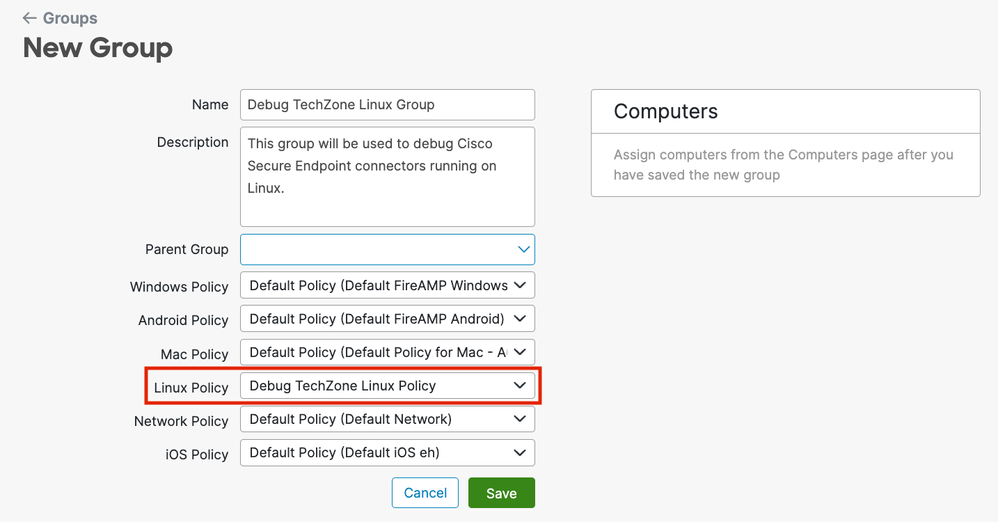
- Enter a name for the group. For example, you could use Debug TechZone Linux Group.
- Change the Linux Policy to the new policy that you just created, which is Debug TechZone Linux Policy in this example. Click
Save.
- Navigate to the Computers page by selecting
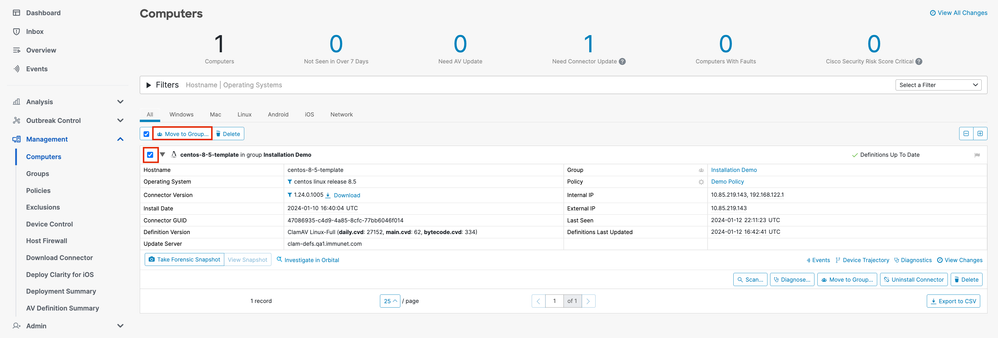
Management -> Computers and identify your computer in the list. Select it and click Move to Group....
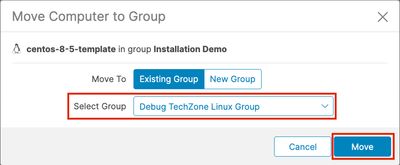
- In the Move Connector to Group pop-up that appears, select your newly created group from the
Select Group dropdown menu. Click Move to move the selected computer into your new group.
Enable Debug Mode Using the Connector Command Line Interface
To enable Debug mode via the Linux connector Command Line Interface (CLI).
1. Login into the ampcli
/opt/cisco/amp/bin/ampcli
2. Enable debug
ampcli> debuglevel 1
The following output should be displayed:
Daemon now logging at 'info' level until next policy update
Disable Debug Mode
After the diagnostic data in Debug mode is obtained, you must revert the Secure Endpoint connector back to the normal mode. Debug mode can be disabled using either the Secure Endpoint Console or using the Linux connectors command line tool.
Disable Debug Mode Using the Secure Endpoint Console
To disable Debug mode, follow the same steps to enable the Debug mode using the Secure Endpoint Console, but change the Connector Log Level to "Default" in step 7.
Disable Debug Mode Using Connector Command Line Interface
To disable Debug mode via the Linux connector CLI, run the following command:
1. Login into the ampcli
/opt/cisco/amp/bin/ampcli
2. Disable debug
ampcli> debuglevel 0
Daemon now logging at policy-specified log level
See Also


 Feedback