Introduction
This document describes Statistics Database principles and disk resources relation to align requirements.
Prerequisites
Requirements
Cisco recommends that you have knowledge of this topics:
- Cisco Software-Defined Wide Area Network (SD-WAN)
- Cisco vManage Controller Graphic User Interface (GUI)
Components Used
The information in this document was created from the devices in a specific lab environment. All of the devices used in this document started with a cleared (default) configuration. If your network is live, ensure that you understand the potential impact of any command.
Note: This document is not restricted to any software version.
Statistics Database
The Statistics Database is one of the main Network Manager Services (NMS) of the vManage controller, it keeps statistical data for audit logs, alarms, events, Deep Packet Inspection (DPI), Netflow, security features and so on.
It uses Elastic Search service to handle and process each feature information with the use of indexes, after it processes the collection of data, the elastic information can be polled from the vManage GUI.
Based on the disk space resources, each vManage calculates automatically its Maximum Available Space to allocate in the Statistics Database Configuration; which by default assigns 5 GB per feature; this can be modified as per requirements.
Before to assign any non-default value of disk space per feature, it is mandatory to validate the Cisco vManage Recommended Computing Resources per software version and overlay details, which are alinged specially if DPI feature is enable; noticed that after 20.6 computing resources replace DPI acronym for SAIE.
How to Estimate and Modify the Disk Usage Per Feature
To determine the required disk space to assign to each feature use the next Application Programming Interface (API) call:
https://vmanage-ip:port/dataservice/management/elasticsearch/index/size/estimate
Replace vmanage-ip:port with the IP and port of the vManage. This API call returns a JavaScript Object Notation (JSON) response with the total disk space and granular details of required disk space to save feature statistics for 1 day, 7 days, 14 days, 30 days, 90 days, 180 days and 1 year.
To validate the current disk assignation in vManage and modify it, navigate to Administration > Settings > Statistics Database Configuration.
Click Edit and modify the size to the desired value based on the overlay requirements, then click Save.
Best Practices
Before to assign resources, it is necesary to validate which features and for which devices statistics are enable to collect data, to do so, navigate to Administration > Settings > Statistics Settings.
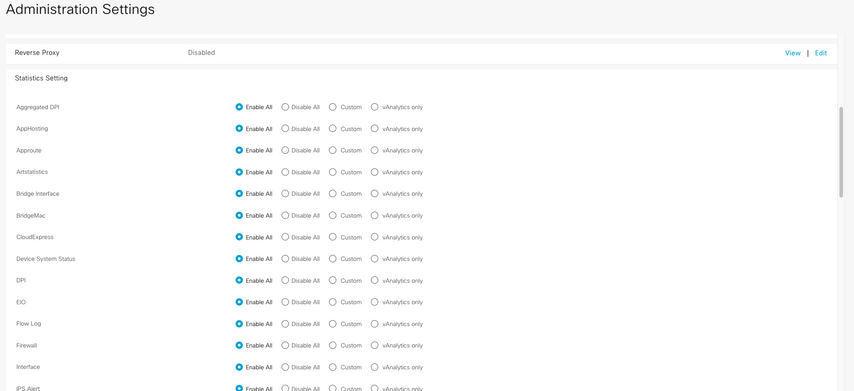
This section shows all features for which vManage Collects data, by default Enable All is set for all features:
- Enable All: Statistics data are processed for all Cisco Edge devices that are operational. If Cisco vAnalitics is enabled and configured, the statistics are also sent out to the cloud.
- Disable All: Statistics data is not collected for any operational device.
- Custom: This allows to do a full range of customization for the devices to which data collection is required.
- vAnalytics Only: All statistics, in the selected feature, are sent to vAnalytics without the need of vManage to process or show them.
After validate that Statistics are enable for the desired features and devices, as this is historical information that consumes disk, it is not possible to assign the total disk space to all features even though vManage allows it; instead, the maximum available space in the Statistics Database Configuration must be split among all features, this value is visible in the Administration > Settings > Statistics Database Configuration; where at the same time the resources are assigned per feature.

The best practice is to configure Statistics Database Configuration disk size not to exceed the 80% of the vManage /opt/data partition; this avoid to run out of resources that can cause unexpected and shorter time periods of statistics saved.
Note: To check the free disk space use the command df -kh | grep "opt/data" in vShell.
Besides the assignation of disk, when DPI/SAIE is enabled, the Statistics poll time must be set to 30 minutes or higher as a best practice; the default Collection Interval(minutes) is 30 minutes.
To modify the poll timer, from the Cisco vManage menu, navigate to Administration > Settings > Statistics Configuration. Click Edit and modify the Collection Interval(minutes) to the desired value based on the DPI traffic, click Save.
Common Statistics Database Issues
vManage does not show oldest statistics from the specified time range
When in Monitor > Network > Select Device and view options inside Applications, WAN, Security Monitoring sections; after a time range is selected in the time filter, old statistics are not displayed or saved data is less than expected.
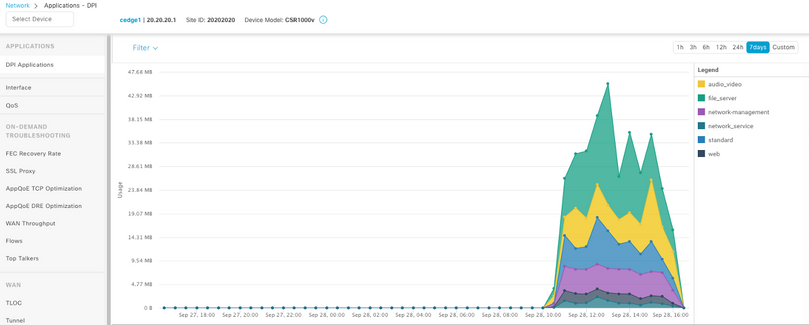
This issue happens because of the disk assignation in the Administration > Settings > Statistics Database Configuration is less than the estimated value obtained by the API call https://vmanage-ip:port/dataservice/management/elasticsearch/index/size/estimate for each feature.
vManage does not update statistics
When in Monitor > Network > Select Device and view options inside Applications, WAN, Security Monitoring sections noticed Statistics, statistics graphs update but not in real time.
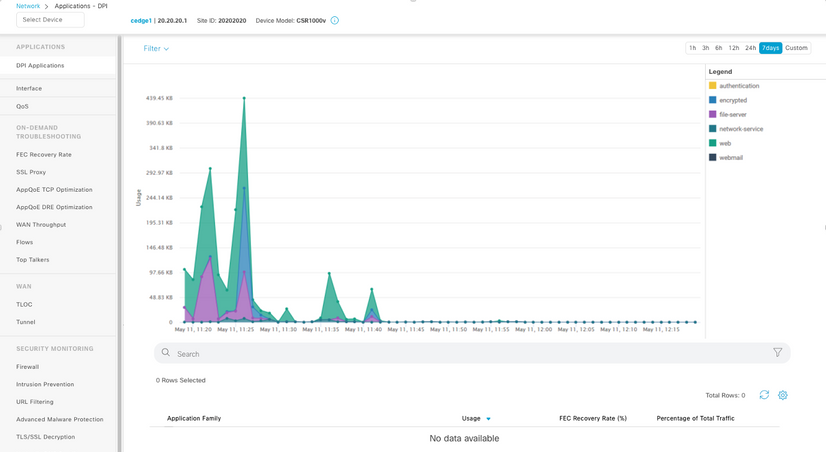
This happens because vManage updates statistics data based on the Statistics Configuration Timer which defaults to 30 minutes, when DPI/SAIE is enabled, higher collection values are recommended; as consequence, the vManage takes longer than 30 minutes to process and update the information.
vManage shows "No data to Display"
When in Monitor > Network > Select Device and view options inside Applications, WAN, Security Monitoring sections, "No Data to Display" message is displayed instead the graph.
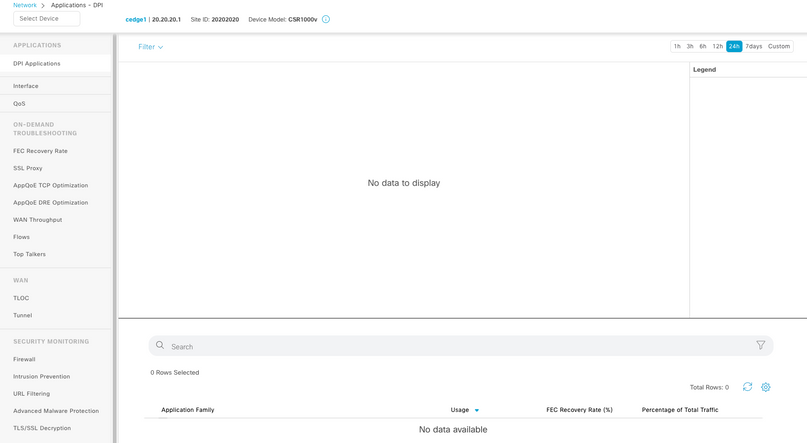
Possible causes:
- Total assignment and disk used in Administration > Settings > Statistics Database Configuration section exceed the Maximum Available Space limit specified at the top of the section; in those cases, the Total Space is flagged in red color as a warning message.
- /opt/data partition exceeds 80% of usage.
- Collection Interval(minute) is set to less than 30 minutes.
- Analytics Only is selected in Administration > Settings > Statistics Settings for the selected feature, so data is only visible on vAnalytics.
Related Information


 Feedback