Introduction
This document describes how to troubleshoot Network Latency (Network 'Slowness') in an SDWAN environment from vManage.
Troubleshoot Network Latency from vManage
Source and Destination IPs
Source and destination IPs are one of the first information to gather. You can provide this information. However, you can always use the DPI Applications tab in vManage, if the issue is application-specific.
Navigate to Network > Device > DPI Applications.
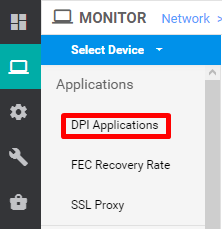
Here, you can dive deep into Applications to get the source and destination IPs (provided you have the information about the application in question).
Here is an example of breadcrumbs to find the source and destination IPs for HTTP traffic.

Simulate Flows
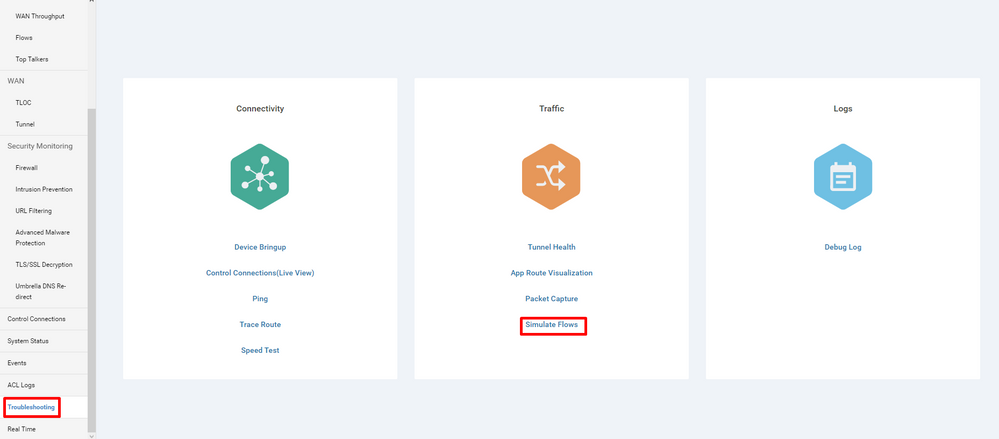
Once you have the source and destination IPs, use SDWANs built-in Simulate Flows to find the next hop for the IPs in question.
Navigate to Network > Device > Troubleshooting > Simulate flows.

Ping and Traceroute
You can use in-built ping and traceroute tools in vManage to troubleshoot reachability.
Navigate to Network > Device > Troubleshooting > ping/Traceroute.
Tunnel Health
The tunnel Health tool comes in handy when you troubleshoot latency between two sites. The tool gives you a comprehensive view of tunnel status over a period of time which you can customize.
You can view statistics about data traffic, traffic jitter, loss, and latency and other interface characteristics for all operational data plane tunnels.
Navigate to Network > Device > Troubleshooting > Tunnel Health.

App Route Visualization
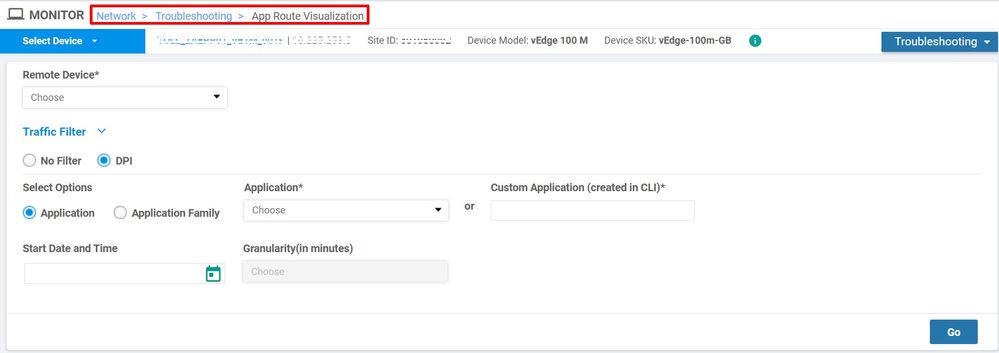
This displays the Application-aware routing statistics in graphical format for all tunnels between the two routers. The top graphs display either loss statistics or latency and jitter statistics.
The bottom graphs display the number of packets received and transmitted on the data planetunnel. By default, statistics for the first six tunnels are shown.
Navigate to Network > Device > Troubleshooting > App Route Visualization.
Packet Capture
To capture control plane and data plane packets in real-time and to save these packets to a file.
Navigate to Network > Device > Troubleshooting > Packet Capture.
Control Connections
Check the control connections up-time to verify whether there are any underlying connectivity issues.
From CLI, run show control connections.
Interface Utilization and Statistics
Interface utilization and statistics can be viewed from the Interface Tab on the left pane. Interface statistics are represented in a graphical view. You can use chart options to filter for specific data.
The time period over which the data to be displayed can be customized.
Navigate to Network > Device > Interface.


 Feedback