Troubleshoot Punt Fabric Data Path Failure on Tomahawk and Lightspeed Card
Available Languages
Download Options
Bias-Free Language
The documentation set for this product strives to use bias-free language. For the purposes of this documentation set, bias-free is defined as language that does not imply discrimination based on age, disability, gender, racial identity, ethnic identity, sexual orientation, socioeconomic status, and intersectionality. Exceptions may be present in the documentation due to language that is hardcoded in the user interfaces of the product software, language used based on RFP documentation, or language that is used by a referenced third-party product. Learn more about how Cisco is using Inclusive Language.
Contents
Introduction
This document describes punt fabric data path failure messages seen during Cisco Aggregation Services Router (ASR) 9000 Series operation.
Background Information
The message appears in this format:
- Alarms are seen on the router console as shown here.
- It means that the loopback path of these messages is broken somewhere.
RP/0/RP0/CPU0:Oct 28 12:46:58.459 IST: pfm_node_rp[349]: %PLATFORM-DIAGS-3-PUNT_FABRIC_DATA_PATH_FAILED :
 Set|online_diag_rsp[24790]|System Punt/Fabric/data Path Test(0x2000004)|failure threshold is 3,
 (slot, NP) failed: (0/9/CPU0, 1) (0/9/CPU0, 3)
The issue occurs for NP1 and NP3 on 0/9/CPU0 mentioned previously.
This document is intended for anyone who wants to understand the error message and the actions that must be taken if the problem is seen.
The Tomahawk-based line card (LC) is available as either a Service Edge Optimized (enhanced QoS) or Packet Transport Optimized (basic QoS) LC.
- SE - Services Edge Optimized
- TR - Packet Transport Optimized
The 4-Port and 8-Port 100 Gigabit Ethernet LC is available in two variants that support either LAN/WAN/OTN unified PHY CPAK ports or LAN PHY-only CPAK ports.
These LCs are Tomahawk-based:
- A9K-8X100G-LB-SE
- A9K-8X100G-LB-TR
- A9K-8X100GE-SE
- A9K-8X100GE-TR
- A9K-4X100GE-SE
- A9K-4X100GE-TR
- A9K-400G-DWDM-TR
- A9K-MOD400-SE
- A9K-MOD400-TR
- A9K-MOD200-SE
- A9K-MOD200-TR
- A9K-24X10GE-1G-SE
- A9K-24X10GE-1G-TR
- A9K-48X10GE-1G-SE
- A9K-48X10GE-1G-TR
- A99-12X100GE
- A99-8X100GE-SE
- A99-8X100GE-TR

Note: Tomahawk-based LC part numbers that begin with A99-X are compatible with the Cisco ASR 9904, ASR 9906, ASR 9910, ASR 9912, and ASR 9922 chassis. They are not compatible with the Cisco ASR 9006 and ASR 9010 Routers.
Lightspeed-based LCs might be available as either a Service Edge Optimized (enhanced QoS) or Packet Transport Optimized (basic QoS) LC. Unlike Tomahawk-based LCs, not every LC model is available in both -SE and -TR types.
- SE - Services Edge Optimized
- TR - Packet Transport Optimized
These LCs are Lightspeed-based:
- A9K-16X100GE-TR
- A99-16X100GE-X-SE
- A99-32X100GE-TR
Lightspeed-Plus (LSP)-based LCs are available as either a Service Edge Optimized (enhanced QoS) or Packet Transport Optimized (basic QoS) LC.
These LCs are LSP-based:
- A9K-4HG-FLEX-TR
- A9K-4HG-FLEX-SE
- A99-4HG-FLEX-TR
- A99-4HG-FLEX-SE
- A9K-8HG-FLEX-TR
- A9K-8HG-FLEX-SE
- A9K-20HG-FLEX-TR
- A9K-20HG-FLEX-SE
- A99-32X100GE-X-TR
- A99-32X100GE-X-SE
- A99-10X400GE-X-TR
- A99-10X400GE-X-SE
Punt Fabric Diagnostic Packet Path
- The diagnostic application that runs on the route processor card CPU injects diagnostic packets destined for each Network Processor (NP) periodically.
- The diagnostic packet is looped back inside the NP and reinjected towards the route processor card CPU that sourced the packet.
- This periodic health check of every NP with a unique packet per NP by the diagnostic application on the route processor card provides an alert for any functional errors on the data path during router operation.
- It is essential to note that the diagnostic application on both the active route processor and the standby route processor injects one packet per NP periodically and maintains a per-NP success or failure count.
- Every minute a diagnostic packet is sent to NP, (to every Virtual Queues Interface (VQI) four times (total of four mins/VQI) and runs over all VQIs of that NP). In order to brief on this, here is an example:
Consider the LC has four NPs, online diagnostics has to exercise all NPs (to know they are healthy - fabric paths). Now, each NP can have 20 VQIs each (0-19, 20 - 39, 40-59, 60-79).
In the first minute, the online diagnostic sends one packet to each NP.
1 min : against VQI 0, 20, 40, 60 (to all 4 NPs)

2 min:""""""""

3 min: """""""

4 min : """""


5th min : against VQI 1, 21, 41, 61..

6 min : """"""""
This repeats in a cycle once all VQI finishes.
- When a threshold of dropped diagnostic packets is reached, the application raises an alarm in Platform Fault Manager (PFM).
RP/0/RP1/CPU0:AG2-2#show pfm location 0/RP1/CPU0
node: node0_RP0_CPU0
---------------------

CURRENT TIME: Apr  7 01:04:04 2022PFM TOTAL: 1   EMERGENCY/ALERT(E/A): 0   CRITICAL(CR): 0   ERROR(ER): 1

-------------------------------------------------------------------------------------------------

Raised Time         |S#|Fault Name                         |Sev|Proc_ID|Dev/Path Name |Handle

--------------------+--+-----------------------------------+---+-------+--------------+----------

Apr  7 00:54:52 2022|0 |PUNT_FABRIC_DATA_PATH_FAILED       |ER |10042 >>ID |System Punt/Fa|0x2000004
In order to collect all information about PFM alarms, capture this command output:
show pfm location all

show pfm trace location all
If you want to see more information about alarms raised by a specific process, you can use this command:
show pfm process name <process_name> location <location> >>> location where the PFM alarm is observed
High-level LC's Architecture
Tomahawk LC
8x100G Architecture
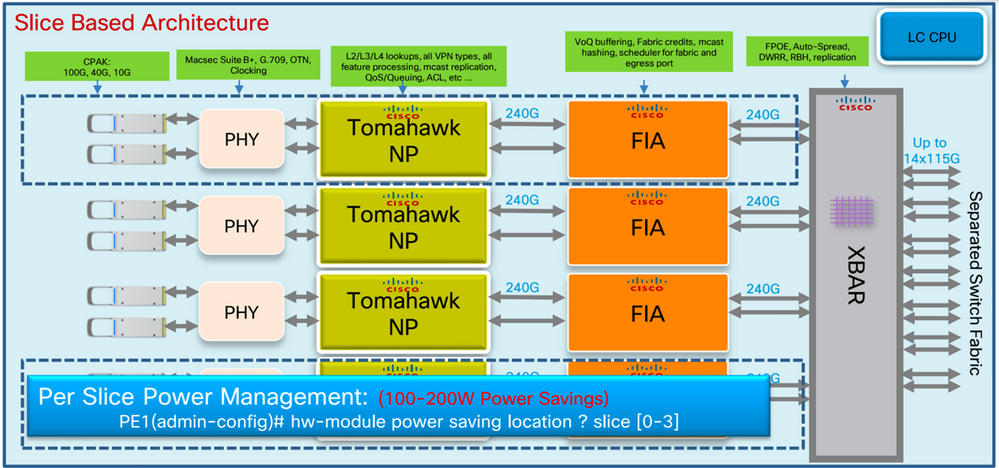 Tomahawk - 8x100G LC
12 x 100G Architecture
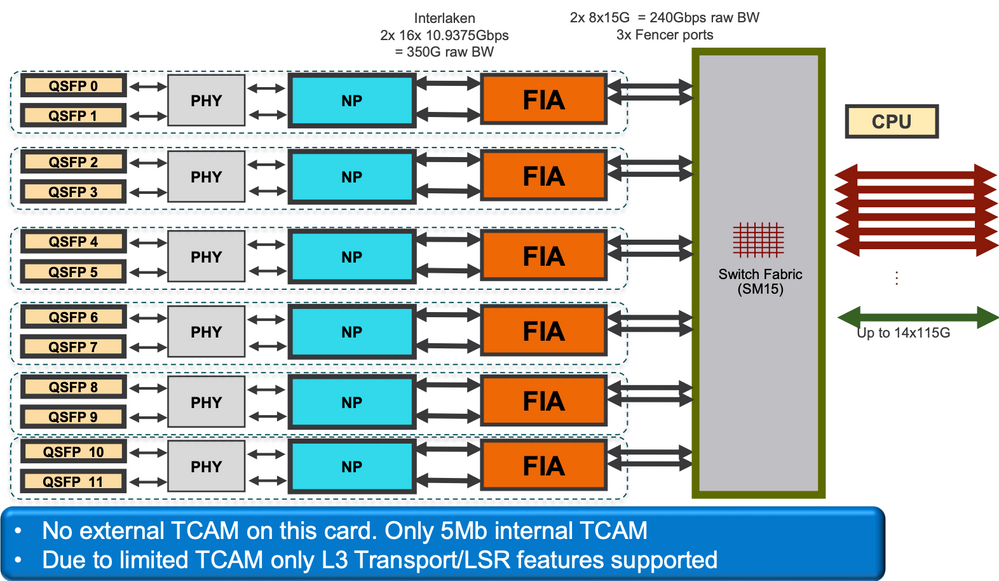 Tomahawk 12*100G LC
Lightspeed LC
A9K-20HG-FLEX-SE/TR
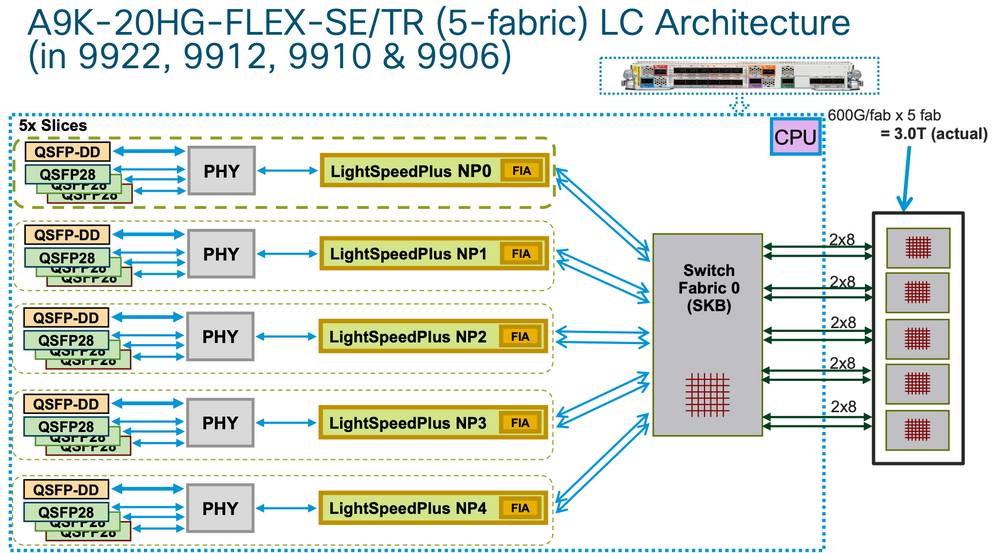 A9K-20HG-FLEX-SE/TR
A99-32x100GE-X-SE/TR
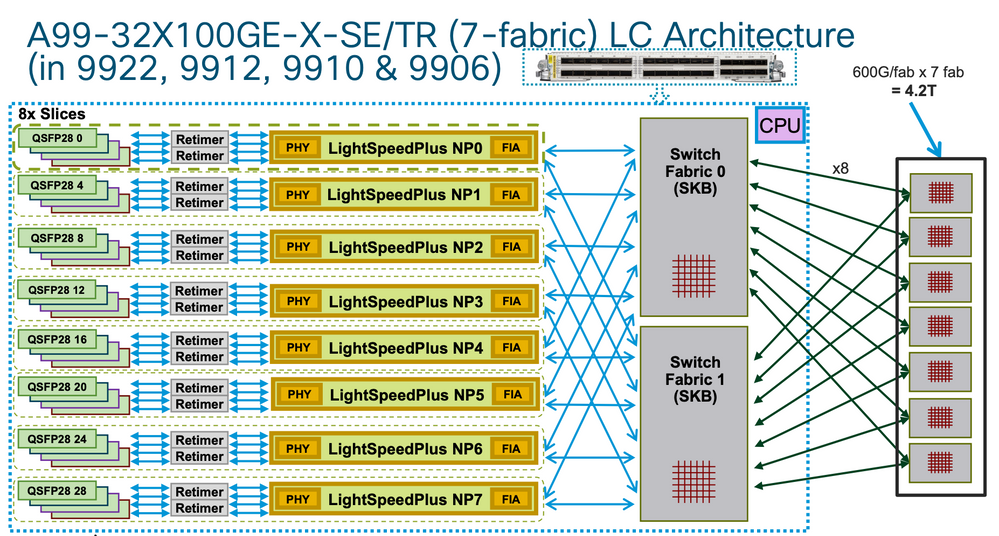 A99-32x100GE-X-SE/TR
A9K-8HG-FLEX-SE/TR
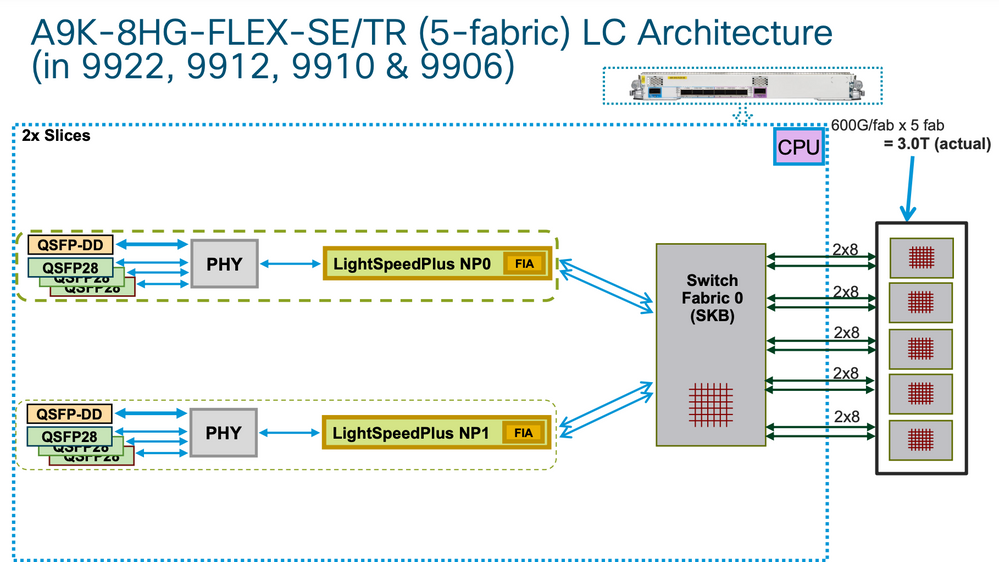 LC Architecture
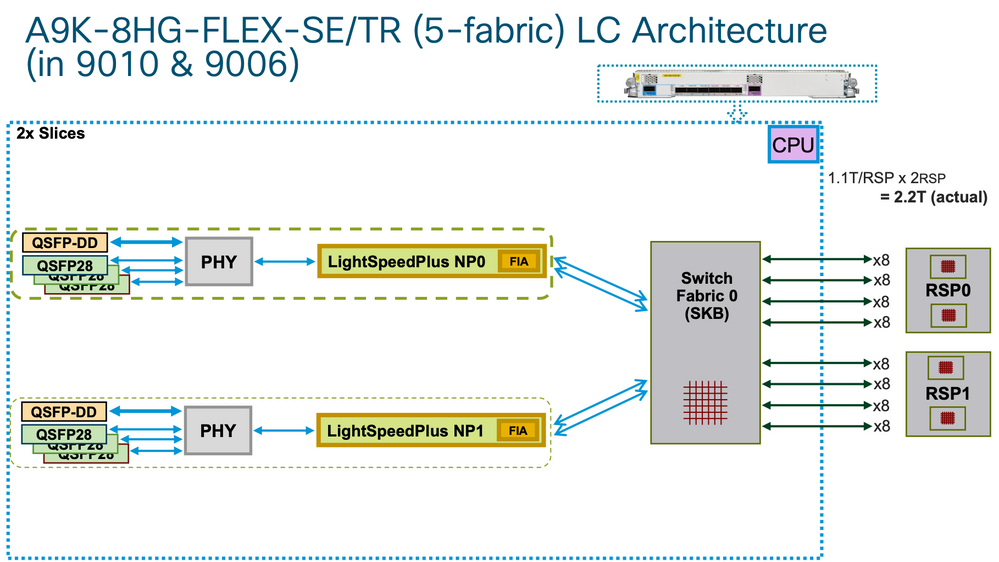 LC Architecture
Virtual Output Queues and the Arbiter
Each Route Switch Processor/Switch Processor (RSP/RP) has two fabric chips which are both controlled by one common arbiter (dual RSPs/RPs means resilient arbiters per chassis). Only the arbiter on the active RSP/RP controls all four fabrics chips (assuming dual RSPs). However both arbiters are receiving the fabric access requests in order to know the state of the whole system at any given time so that failover between RSPs/RPs can be instantaneous. There is no keepalive between the arbiters, but the RSPs/RPs have a Complex Programmable Logic Device (CPLD) ASIC (similar to an FPGA) and one of its functions is to track the other RSP/RP state via low-level keepalives and establish which the active arbiter is.
Every Fabric Interconnect ASIC has a set of VQIs, which is a set of queues that represent a 100G entity in the system (for Tomahawk). Every 100G entity (1x100G ports on a single egress NP are represented with a single 100G VQI in an ingress NP) has multiple priority classes.
Every VQI has a set of four Virtual Output Queues (VOQs), for different packet priorities, out of which three are used in ASR 9000 forwarding architecture. These correspond to priority levels 1, and 2 and default in ingress QoS policy. There are two strict priority queues and one normal queue (the fourth queue is for multicast and is not used for unicast forwarding).
Generally, the default queue starts to drop packets first during back pressure from the egress NP VQIs. Only when the egress Network Processing Unit (NPU) is getting overloaded (serving more Bps or PPS than the circuits can handle), it starts to exert back pressure on the ingress LC/NP. This is represented by a VQI flow stalling on the Fabric Interface ASIC (FIA) on that ingress LC.
Example:
RP/0/RP0/CPU0:AG3_1#show controllers np ports all location 0/0/CPU0  >>> LC0 is installed in slot 2

                Node: 0/0/CPU0:

----------------------------------------------------------------

NP Bridge Fia                       Ports

-- ------ --- ---------------------------------------------------

0  --     0   TenGigE0/0/0/0/0 - TenGigE0/0/0/0/9, TenGigE0/0/0/1/0 - TenGigE0/0/0/1/9

1  --     1   TenGigE0/0/0/2/0 - TenGigE0/0/0/2/9, HundredGigE0/0/0/3

2  --     2   HundredGigE0/0/0/4 - HundredGigE0/0/0/5  >>>Below is the VQI assignment

3  --     3   HundredGigE0/0/0/6 - HundredGigE0/0/0/7

RP/0/RP0/CPU0:AG3_1#sh controller fabric vqi assignment slot 2

 slot = 2

<snip>

fia_inst = 2 >>>FIA 2

 VQI = 40       SPEED_100G

 VQI = 41       SPEED_100G

 VQI = 42       SPEED_100G

 VQI = 43       SPEED_100G

 VQI = 44       SPEED_100G

 VQI = 45       SPEED_100G

 VQI = 46       SPEED_100G

 VQI = 47       SPEED_100G

 VQI = 56       SPEED_100G

 VQI = 57       SPEED_100G

 VQI = 58       SPEED_100G

 VQI = 59       SPEED_100G

 VQI = 60       SPEED_100G

 VQI = 61       SPEED_100G

 VQI = 62       SPEED_100G

 VQI = 63       SPEED_100G
When the ingress LC decides that it wants to send a particular packet to a particular egress NPU, the modify (MDF) stage on the ingress LC encapsulated a packet with a fabric destination header. When the FIA looks at that "address", it checks the VOQ for the particular egress NPU/destination/LC and sees if there is enough bandwidth available. When it is ready to dequeue it to that LC, the ingress FIA requests a grant from the fabric (the arbiter) for that destination LC. The Arbitration algorithm is QOS aware, it ensures that P1 class packets have preference over P2 class and so on. The arbiter relays the grant request from the ingress FIA to the egress FIA.
The ingress FIA can group multiple packets together going to that same egress LC into what is called a superframe. This means it is not native frames/packets that go over the switch fabric links but superframes. This is important to note because, in a test of a constant 100pps, the CLI can show the fabric counters only reporting 50pps. This is not packet loss, it would just mean that there are two packets in each superframe transmitting over the switch fabric. Superframes include sequencing information and destination FIAs support reordering (packets can be "sprayed" over multiple fabric links). Only unicast packets are placed into superframes, never multicast ones.
Once the packet is received by the egress LC, the grant is returned to the arbiter. The arbiter has a finite number of tokens per VOQ. When the arbiter permits the ingress FIA to send a (super) frame to a specific VOQ, that token is returned to the pool only when the egress FIA delivers the frames to the egress NP. If the egress NP has raised a back-pressure signal to the egress FIA, the token remains occupied. This is how the arbiter eventually runs out of tokens for that VOQ in the ingress FIA. When that happens, the ingress FIA starts dropping the incoming packets. The trigger for the back pressure is the utilisation level of Receive Frame Descriptor (RFD) buffers in an egress NP. RFD buffers are holding the packets while the NP microcode is processing them. The more feature processing the packet goes through, the longer it stays in RFD buffers.
- Ingress FIA makes fabric requests to all chassis arbiters.
- Active arbiter checks for free access grant tokens and processes its QoS algorithm if congestion is present.
- Credit mechanism from local arbiter to active arbiter on RSP.
- Active arbiter sends fabric grant token to ingress FIA.
- Ingress FIA load-balances (super)frames over fabric links.
- Egress FIA returns a fabric token to the central arbiter.
Better to mention, the credit mechanism from the local arbiter to the active arbiter on RSP. Also add another section to cover possible cases of arbiter faults (do not need to mention error codes, but to have a look at arbiter ASIC errors) to look at in case of any arbiter issue and not getting grants because of local or central arbiter and that causes queue pile up.
Virtual Output Queue Overview
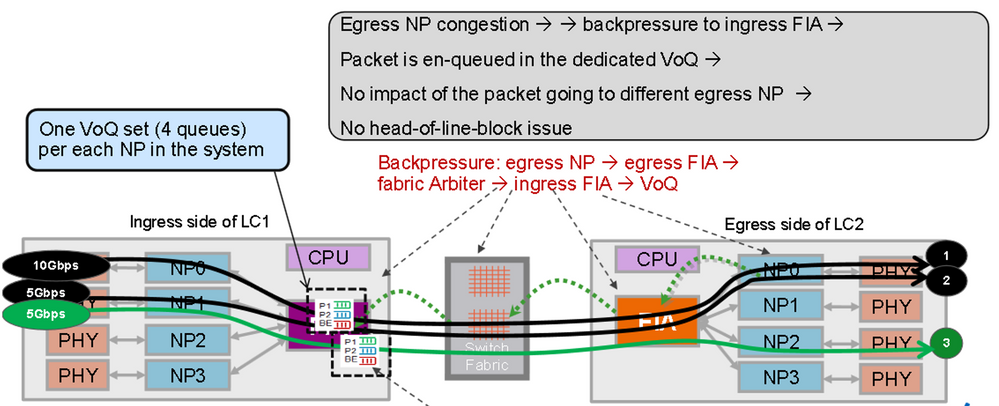 Virtual Output Queue
Packets going to different egress NPs are put into different VOQ sets. Congestion on one NP does not block the packet that goes to different NPs.
Fabric Arbiter Diagram
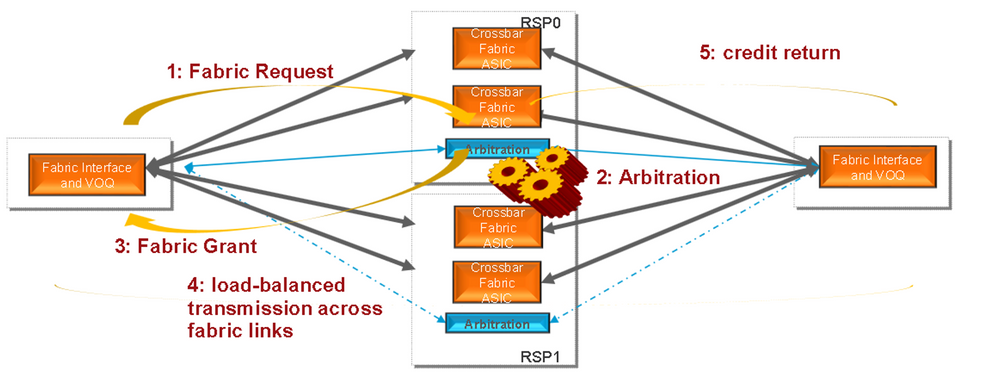 Fabric Arbiter
Fabric Interconnects
ASR9006 and ASR9010 Switch Fabric Interconnects
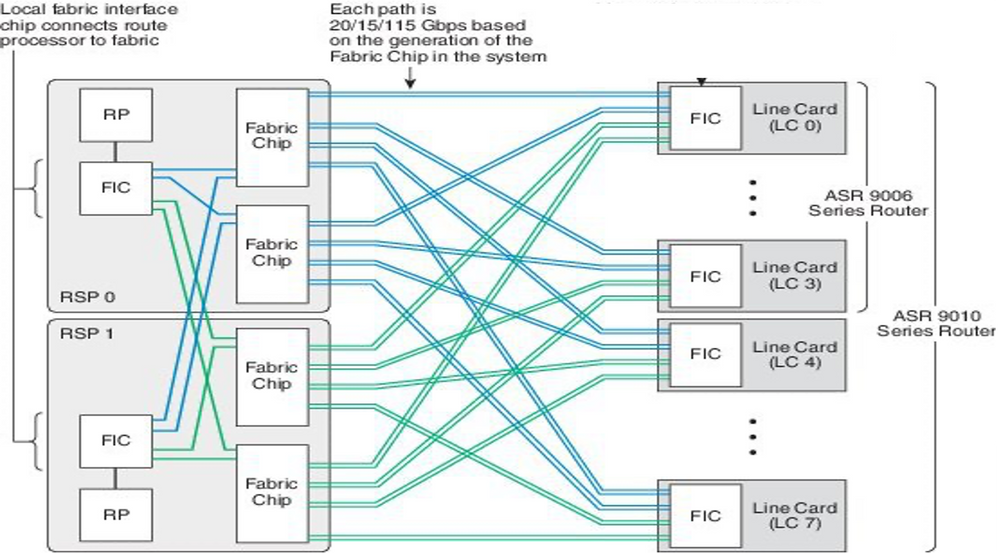 ASR9006 and ASR9010 Switch Fabric Interconnects
ASR9922 Switch Fabric Interconnects
The ASR9912 is the same with support for only 10 LCs and a single Fabric Interconnect Chip.
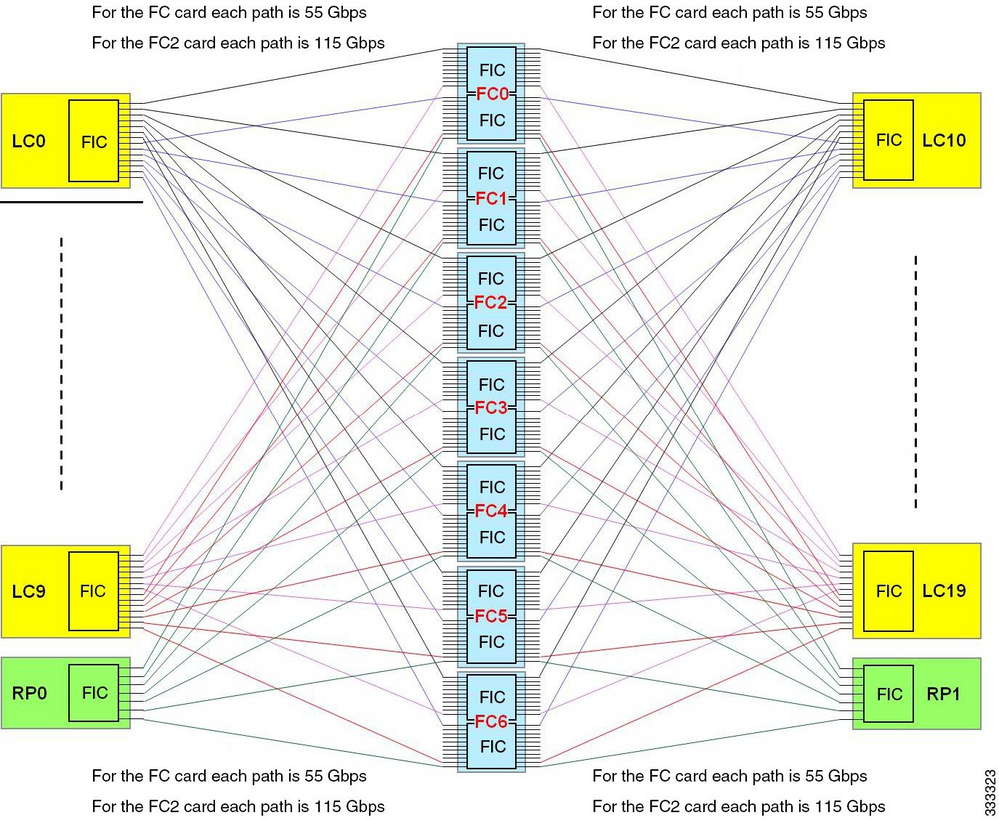 ASR9922 Switch Fabric Interconnects
ASR9922 and ASR9912 Backplane
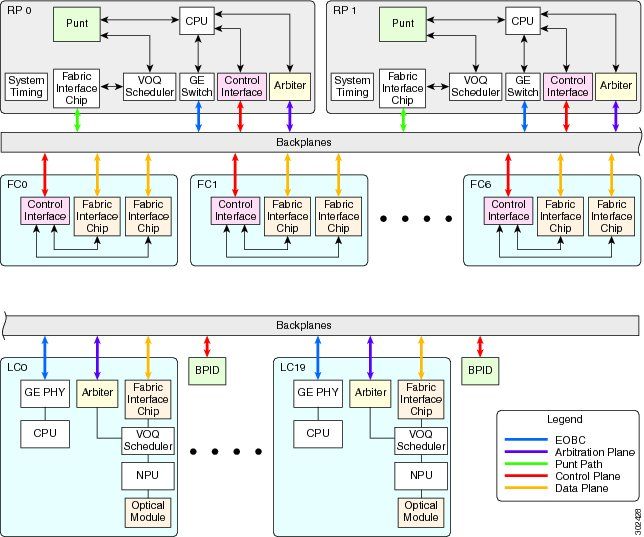 ASR9922 and ASR9912 Backplane
Overview of Online Diagnostics
- The online diagnostic tool runs both on LC and RP CPU.
- Diagnostic tests that test the forwarding path are:
- PuntFabricDataPath test running on active and standby RP CPU, sending diagnostic packets to every active NP in the system. Active RP sends.
- PuntFabricDataPath diagnostic packets as unicast, while standby sends them as multicast. Response packets are sent back to originating RP CPU.
- Diagnostic tests that test the forwarding path are:
- NP Loopback test within LC.
- NPULoopback test running on every LC CPU, sending diagnostic packets to every NP. Response packets are sent back to LC CPU.
Triage the Issue
The steps here provide some hints on how to narrow down the issues related to the punt-path failure. They do not need to be followed in the exact same order.
Information Needed to Start the Triage
- Find the affected NP and LC:
show logging | inc “PUNT_FABRIC_DATA_PATH”

RP/0/RP1/CPU0:Oct 28 12:46:58.459 IST: pfm_node_rp[349]: %PLATFORM-DIAGS-3-PUNT_FABRIC_DATA_PATH_FAILED :
 Set|online_diag_rsp[24790]|System Punt/Fabric/data Path Test(0x2000004)|failure threshold is 3, (slot, NP)
 failed: (0/9/CPU0, 1) (0/9/CPU0, 3)
The issue occurs for NP1 and NP3 on 0/9/CPU0 mentioned previously.
- In order to find the chassis slot, enter the
run nslot allcommand. - PFM alarm
RP/0/RP1/CPU0:AG2-2#show pfm location 0/RP1/CPU0
node: node0_RP1_CPU0

---------------------

CURRENT TIME: Mar 25 12:11:29 2022

PFM TOTAL: 1   EMERGENCY/ALERT(E/A): 0   CRITICAL(CR): 0   ERROR(ER): 1

-------------------------------------------------------------------------------------------------

Raised Time         |S#|Fault Name                         |Sev|Proc_ID|Dev/Path Name |Handle

--------------------+--+-----------------------------------+---+-------+--------------+----------

Mar 25 12:03:30 2022|1 |PUNT_FABRIC_DATA_PATH_FAILED       |ER |8947   |System Punt/Fa|0x2000004

RP/0/RP1/CPU0:AG2-2#sh pfm process 8947 location 0/rp1/CPU0

node: node0_RP1_CPU0

---------------------

CURRENT TIME: Mar 25 12:12:36 2022

PFM TOTAL: 1   EMERGENCY/ALERT(E/A): 0   CRITICAL(CR): 0   ERROR(ER): 1

PER PROCESS TOTAL: 0   EM: 0   CR: 0   ER: 0

Device/Path[1 ]:Fabric loopbac  [0x2000003 ] State:RDY  Tot: 0

Device/Path[2 ]:System Punt/Fa  [0x2000004 ] State:RDY  Tot: 1

1   Fault Id:          432

    Sev:               ER

    Fault Name:        PUNT_FABRIC_DATA_PATH_FAILED

    Raised Timestamp:  Mar 25 12:03:30 2022

    Clear Timestamp:   Mar 25 12:07:32 2022

    Changed Timestamp: Mar 25 12:07:32 2022

    Resync Mismatch:   FALSE

    MSG:               failure threshold is 3, (slot, NP) failed: (0/9/CPU0, 1) (0/9/CPU0, 3)
Diagnostics Packet Flow Diagram
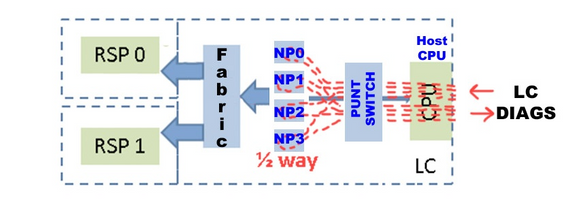
- DIAG messages packet path between RP and LC (the diagnostic packet interval is one minute).
Packet path on RP:
online_diags <===> SPP <===> Fabric <===> NP
Packet path on LC:
online_diags <===> SPP <===> Punt-switch <====> NP
- NP Loopback test within LC
Every minute a DIAGS packet per NP is injected from the LC CPU to the Punt Switch, and all are looped back at the NPs. They do NOT go to the fabric at all. The turnaround point or halfway mark is each NP's microcode.
- Diagnostic send path: LC: online diagnostics > Inject > LC-NP > (loop)
- Diagnostic return path: LC-NP > Punt > online diagnostics: LC
Diagnostic Test
RP/0/RP0/CPU0:AG2-2(admin)#show diagnostic content location <> >>> (in cXR)
RP/0/RP0/CPU0:AG2-2#show diagnostic content location <> >>> (in eXR)
A9K-8X100GE-L-SE 0/0/CPU0:

  Diagnostics test suite attributes:

    M/C/* - Minimal bootup level test / Complete bootup level test / NA

    B/O/* - Basic ondemand test / not Ondemand test / NA

    P/V/* - Per port test / Per device test / NA

    D/N/* - Disruptive test / Non-disruptive test / NA

      S/* - Only applicable to standby unit / NA

      X/* - Not a health monitoring test / NA

      F/* - Fixed monitoring interval test / NA

      E/* - Always enabled monitoring test / NA

      A/I - Monitoring is active / Monitoring is inactive

      n/a -  Not applicable


                                                         Test Interval    Thre- Timeout

  ID   Test Name                          Attributes     (day hh:mm:ss.ms shold ms   )

  ==== ================================== ============ ================= =====  =====

    1) CPUCtrlScratchRegister ----------> *B*N****A       000 00:01:00.000 3 n/a

    2) DBCtrlScratchRegister -----------> *B*N****A       000 00:01:00.000 3 n/a

    3) PortCtrlScratchRegister ---------> *B*N****A       000 00:01:00.000 3 n/a

    4) PHYScratchRegister --------------> *B*N****A       000 00:01:00.000 3 n/a

    5) NPULoopback ---------------------> *B*N****A       000 00:01:00.000 3 n/a
RP/0/RP0/CPU0:AG2-2#show diagnostic result location 0/0/CPU0
A9K-8X100GE-L-SE 0/0/CPU0:
  Overall diagnostic result: PASS

  Diagnostic level at card bootup: bypass

  Test results: (. = Pass, F = Fail, U = Untested)

  1  ) CPUCtrlScratchRegister ----------> .

  2  ) DBCtrlScratchRegister -----------> .

  3  ) PortCtrlScratchRegister ---------> .

  4  ) PHYScratchRegister --------------> .

  5  ) NPULoopback ---------------------> .
- You can test this parameter "inject diags packets" manually in detail as mentioned in this example:
admin diag start location 0/x/cpu0 test NPULoopback (cXR)


RP/0/RP0/CPU0:AG3_1#diagnostic start location 0/0/CPU0 test NPULoopback   >>> eXR

Fri May 13 06:53:00.902 EDT
RP/0/RP0/CPU0:AG3_1#show diagnostic res location 0/0/CPU0 test 5 detail >>> Here there are
 multiple test 1-5 (check previous examples)

Test results: (. = Pass, F = Fail, U = Untested)
___________________________________________________________________________

  5  ) NPULoopback ---------------------> .

          Error code ------------------> 0 (DIAG_SUCCESS)

          Total run count -------------> 67319

          Last test execution time ----> Fri May 13 06:53:01 2022

          First test failure time -----> n/a

          Last test failure time ------> n/a

          Last test pass time ---------> Fri May 13 06:53:01 2022

          Total failure count ---------> 0

          Consecutive failure count ---> 0

  ___________________________________________________________________________
- Check if NP is receiving/sending DIAG messages:
RP/0/RSP1/CPU0:AG2-2#show controllers np counters location | inc DIAG| LC_CPU

 108  PARSE_RSP_INJ_DIAGS_CNT               25195          0  >>> total DIAG packets injected by Active+Stdby RP
 904  PUNT_DIAGS_RSP_ACT                    12584          0  >>> Loopbacks to Active RP
 906  PUNT_DIAGS_RSP_STBY                   12611          0  >>> Loopbacks to Stdby R
 122  PARSE_LC_INJ_DIAGS_CNT                2618           0  >>> total DIAG packets injected by LC
 790  DIAGS                                12618           0  >>> total DIAG packets replied back to LC

16  MDF_TX_LC_CPU                     3998218312         937  >>> a packet punted to LC CPU


PARSE_RSP_INJ_DIAGS_CNT should match (PUNT_DIAGS_RSP_ACT + PUNT_DIAGS_RSP_STDBY)
PARSE_LC_INJ_DIAGS_CNT should match DIAGS

PARSE_XX_INJ_DIAGS_CNT should increment periodically.
- Checking if the Software Packet Path (SPP) is sending/receiving DIAG messages:
show spp sid stats location | inc DIAG

2. DIAG                        35430
 2. DIAG                        35430
These are received and sent DIAG counters. They can always match and increment together on LC.
- debug punt-inject l2-packets diag np 0 location 0/9/CPU0
Example Logs: SPP is sending and receiving the diagnostic packet with sequence no 0x4e packets.
LC/0/1/CPU0:Jun 6 04:14:05.581 : spp[89]: Sent DIAG packet. NP:0 Slot:0 Seq:0x4e

LC/0/1/CPU0:Jun 6 04:14:05.584 : spp[89]: Rcvd DIAG packet. NP:0 Slot:0 Seq:0x4e
- Check for any drops in the packet path:
show drops all location
show drops all ongoing location
- Check online diagnostics debugs (in cXR):
Online-diagnostics are helpful many times in checking the timestamps when packets were sent/received or missed. Such timestamps can be compared with SPP captures for packet correlation.
admin debug diagnostic engineer location
admin debug diagnostic error location

Note: Enter the admin undebug all command in order to disable these debugs.
Sample outputs from the debugs:
RP/0/RSP0/CPU0:Mar 25 05:43:43.384 EST: online_diag_rsp[349]: Slot 1 has 4 NPs  >>> Sending DIAG
 messages to NPs on slot 1

RP/0/RSP0/CPU0:Mar 25 05:43:43.384 EST: online_diag_rsp[349]: PuntFabricDataPath: sending
 a pak (seq 25), destination physical slot 1 (card type 0x3d02aa), NP 0, sfp=0xc6
RP/0/RSP0/CPU0:Mar 25 05:43:43.384 EST: online_diag_rsp[349]: PuntFabricDataPath: sending
 a pak (seq 25), destination physical slot 1 (card type 0x3d02aa), NP 1, sfp=0xde
RP/0/RSP0/CPU0:Mar 25 05:43:43.384 EST: online_diag_rsp[349]: PuntFabricDataPath: sending
 a pak (seq 25), destination physical slot 1 (card type 0x3d02aa), NP 2, sfp=0xf6
RP/0/RSP0/CPU0:Mar 25 05:43:43.384 EST: online_diag_rsp[349]: PuntFabricDataPath: sending
 a pak (seq 25), destination physical slot 1 (card type 0x3d02aa), NP 3, sfp=0x10e

RP/0/RSP0/CPU0:Mar 25 05:43:43.888 EST: online_diag_rsp[349]: PuntFabricDataPath:
 Time took to receive 22 pkts: 503922888 nsec, timeout value: 500000000 nsec
RP/0/RSP0/CPU0:Mar 25 05:43:43.888 EST: online_diag_rsp[349]: PuntFabricDataPath:
 Received 22 packets, expected 24  => Some replies missed

RP/0/RSP0/CPU0:Mar 25 05:43:43.888 EST: online_diag_rsp[349]: PuntFabricDataPath:
 Got a packet from physical slot 1, np 0
RP/0/RSP0/CPU0:Mar 25 05:43:43.888 EST: online_diag_rsp[349]: Successfully verified
 a packet, seq. no.: 25
RP/0/RSP0/CPU0:Mar 25 05:43:43.888 EST: online_diag_rsp[349]: PuntFabricDataPath:
 Got a packet from physical slot 1, np 2  <= Replies from NP1 and NP3 missing
RP/0/RSP0/CPU0:Mar 25 05:43:43.888 EST: online_diag_rsp[349]: Successfully verified
 a packet, seq. no.: 25
RP/0/RSP0/CPU0:Mar 25 05:43:43.888 EST: online_diag_rsp[349]: PuntFabricDataPath:
 Got a packet from physical slot 3, np 0
- Diagnostic trace:
RP/0/RP1/CPU0:AG2-2#show diagnostic trace location 0/rp1/CPU0

Fri Mar 25 12:16:40.866 IST

1765 wrapping entries (3136 possible, 2048 allocated, 0 filtered, 3503120 total)

Mar 16 02:40:21.641 diags/online/gold_error 0/RP1/CPU0 t7356 Failed to get ack: got 0 responses,
 expected 1

Mar 16 02:40:36.490 diags/online/message 0/RP1/CPU0 t8947 My nodeid 0x120, rack# is 0, slot# 1,
 board type = 0x100327

Mar 16 02:40:36.948 diags/online/message 0/RP1/CPU0 t8947 dev cnt=25, path cnt=3, shm loc for
 dev alarms@0x7fd4f0bec000, path alarms@0x7fd4f0bec01c, path alarm data@0x7fd4f0bec028

Mar 16 02:40:37.022 diags/online/message 0/RP1/CPU0 t8947 Last rpfo time: 1647378637

Mar 24 06:03:27.479 diags/online/error 0/RP1/CPU0 2105# t9057 PuntFabricDataPath test error:
 physical slot 11(LC# 9): expected np mask: 0x0000000f, actual: 0x0000000b, failed: 0x00000004

Mar 24 06:03:27.479 diags/online/error 0/RP1/CPU0 634# t9057 PuntFabricDataPath test failure detected,
 detail in the form of (0-based) (slot, NP: count): (LC9,2: 13)
Fabric Triage
- Fabric health (this provides a summary of Link status, statistics, drops, and alarms):
show controllers fabric health location <>
- Spine health:
show controllers fabric health spine all
- Onboard Failure Logging (OBFL) (after reload also this would be available):
admin

sysadmin-vm:0_RP0# show logging onboard fabric location 0/0
- Check fabric counters on ingress LC FIA:
show controllers fabric fia errors ingress location <>

show controllers fabric fia stats location <LC/RP>
- Ingress LC crossbar (not applicable to Trident and SIP-700):
show controllers fabric crossbar statistics instance [0-1] location <>
- Egress LC crossbar (not applicable to Trident and SIP-700):
show controllers fabric crossbar statistics instance [0-1] location <>
- Egress LC FIA:
show controllers fabric fia errors egress location <>
show controllers fabric fia stats location <LC/RP>
- Spine statistics:
show controllers fabric crossbar statistics instance [0-1] spine [0-6]
- Check fabric drops:
- Ingress LC FIA:
show controllers fabric fia drops ingress location <>
- Egress LC FIA:
show controllers fabric fia drops egress location <>
- ASIC errors:
- LSP:
show controllers fabric crossbar asic-errors instance 0 location<>
show asic-errors fia <> all location <>
-
- Tomahawk:
show asic-errors fia <> all location <>
RP/0/RP0/CPU0:AG3_1#show controllers np fabric-counters all np0 location 0/0/CPU0
                Node: 0/0/CPU0:

----------------------------------------------------------------

Egress fabric-to-bridge interface 2 counters for NP 0

 INTERLAKEN_CNT_TX_BYTES                       0x000073fc 23b6d99b

 INTERLAKEN_CNT_TX_FRM_GOOD                    0x000000ae a79d6612

 INTERLAKEN_CNT_TX_FRM_BAD                     0x00000000 00000000 >>> this is 0 which is good,
 need to check if it is incremented

 -------------------------------------------------------------

Egress fabric-to-bridge interface 3 counters for NP 0

 INTERLAKEN_CNT_TX_BYTES                       0x0004abdd fe02068d

 INTERLAKEN_CNT_TX_FRM_GOOD                    0x000005b8 089aac95

 INTERLAKEN_CNT_TX_FRM_BAD                     0x00000000 00000000

 -------------------------------------------------------------
                Node: 0/0/CPU0:
----------------------------------------------------------------

Ingress fabric-to-bridge interface 2 counters for NP 0

 INTERLAKEN_CNT_RX_BYTES                       0x0004aeb5 a4b9dbbe

 INTERLAKEN_CNT_RX_FRM_GOOD                    0x0000058e b7b91c15

 INTERLAKEN_CNT_RX_FRM_BAD                     0x00000000 00000000

 INTERLAKEN_CNT_RX_BURST_CRC32_ERROR           0x00000000 00000000

 INTERLAKEN_CNT_RX_BURST_CRC24_ERROR           0x00000000 00000000

 INTERLAKEN_CNT_RX_BURST_SIZE_ERROR            0x00000000 00000000

 -------------------------------------------------------------

Ingress fabric-to-bridge interface 3 counters for NP 0

 INTERLAKEN_CNT_RX_BYTES                       0x000094ce b8783f95

 INTERLAKEN_CNT_RX_FRM_GOOD                    0x000000f5 33cf9ed7

 INTERLAKEN_CNT_RX_FRM_BAD                     0x00000000 00000000

 INTERLAKEN_CNT_RX_BURST_CRC32_ERROR           0x00000000 00000000

 INTERLAKEN_CNT_RX_BURST_CRC24_ERROR           0x00000000 00000000

 INTERLAKEN_CNT_RX_BURST_SIZE_ERROR            0x00000000 00000000
- In order to verify the link status of the FIA:
show controllers fabric fia link-status location <lc/RSP>
RP/0/RP0/CPU0:AG3_1#show controllers fabric fia link-status location 0/0/CPU0
 ********** FIA-0 **********

Category: link-0
spaui link-0                       Up >>> FIA to NP link

spaui link-1                       Up >>> FIA to NP link

arb  link-0                       Up >>> Arbitor link

xbar link-0                       Up >>> FIA to XBAR link

xbar link-1                       Up >>> FIA to XBAR link

xbar link-2                       Up >>> FIA to XBAR link
- In order to verify the link status of XBAR:
RP/0/RP0/CPU0:AG3_1#show controllers fabric crossbar link-status instance 0 lo 0/0/CPU0

Mon May  2 04:05:06.161 EDT

PORT    Remote Slot  Remote Inst    Logical ID  Status

======================================================

00      0/0/CPU0            01             2        Up

01      0/FC3               01             0        Up

02      0/FC3               00             0        Up

03      0/FC4               01             0        Up

04      0/FC2               01             0        Up

05      0/FC4               00             0        Up

06      0/FC2               00             0        Up

07      0/FC1               01             0        Up

10      0/FC1               00             0        Up

14      0/FC0               01             0        Up

15      0/FC0               00             0        Up

16      0/0/CPU0            02             0        Up

18      0/0/CPU0            02             2        Up

19      0/0/CPU0            02             1        Up

20      0/0/CPU0            03             2        Up

21      0/0/CPU0            03             1        Up

22      0/0/CPU0            03             0        Up

23      0/0/CPU0            00             2        Up

24      0/0/CPU0            00             1        Up

25      0/0/CPU0            00             0        Up

26      0/0/CPU0            01             0        Up

27      0/0/CPU0            01             1        Up
If you observe these logs in the LSP card:
LC/0/3/CPU0:Jul  5 13:05:53.365 IST: fab_xbar[172]: %PLATFORM-CIH-5-ASIC_ERROR_THRESHOLD :
 sfe[1]: An interface-err error has occurred causing  packet drop transient.
 ibbReg17.ibbExceptionHier.ibbReg17.ibbExceptionLeaf0.intIpcFnc0UcDataErr  Threshold has been exceeded
17*2 here helps to identify the port with the show controllers fabric crossbar link-status instance 1 lo 0/3/CPU0 command:
Logs Collection:
show platform
show inventory
show tech fabric
show tech np
show tech ethernet interface
show logging
show pfm location all
show pfm trace location <location id>
show controllers pm vqi location all
show hw-module fpd location all (cxr) / admin show hw-module fpd (exr)
show controllers fti trace <process-name>  location  <Card location>
admin show tech obfl

Cxr:
From Admin:
show logging onboard common location <>
show logging onboard error location <>

Exr:
From sysadmin/calvados:
show logging onboard fabric location <>
- If there are ASIC errors in FIA:
For LS:
show controllers asic LS-FIA instance <instance> block <block_name> register-name <register_name> location <>
For LSP:
show controllers asic LSP-FIA instance <instance> block <block_name> register-name <register_name> location <>
If the error reported is like this:
LC/0/9/CPU0:Mar  1 05:12:25.474 IST: fialc[137]: %PLATFORM-CIH-5-ASIC_ERROR_THRESHOLD :
fia[3]: A link-err error has occurred causing  performance loss persistent.
fnc2serdesReg1.fnc2serdesExceptionHier.fnc2serdesReg1.fnc2serdesExceptionLeaf0.
iNTprbsErrTxphyrdydropped6  Threshold has been exceeded
- The instance is the instance number of the FIA ASIC. Here it is “3” block_name is “fnc2serdesReg1” and register_name is “fnc2serdesExceptionLeaf0”.
- If ASIC errors on LC/RSP XBAR:
show controllers asic SKB-XBAR instance <instance> block-name <block_name> register-name <register_name> location <>
If the error reported is like this:
LC/0/7/CPU0:Mar  4 06:42:01.241 IST: fab_xbar[213]: %PLATFORM-CIH-5-ASIC_ERROR_THRESHOLD :
 sfe[0]: An interface-err error has occurred causing  packet drop transient.
 ibbReg11.ibbExceptionHier.ibbReg11.ibbExceptionLeaf0.intIpcFnc1UcDataErr  Threshold has been exceeded
- The instance is the instance a number of the SFE/XBAR ASIC. Here, “0” block_name is “ibbReg11” and register_name is “ibbExceptionLeaf0”.
- If ASIC errors are reported on FC XBAR:
show controllers asic FC2-SKB-XBAR instance <instance> block-name <block_name> register-name <register_name> location <Active_RP>
If the error reported is like this:
RP/0/RP0/CPU0:Mar  4 06:41:14.398 IST: fab_xbar_sp3[156]: %PLATFORM-CIH-3-ASIC_ERROR_SPECIAL_HANDLE_THRESH :
 fc3xbar[1]: A link-err error has occurred causing  packet drop transient.
 cflReg17.cflExceptionHier.cflReg17.cflExceptionLeaf4.intCflPal1RxAlignErrPktRcvd  Threshold has been exceeded
Then ASIC is “FC3-SKB-XBAR” instance is the instance a number of the SFE/XBAR ASIC. Here it is “1”, both come from “fc3xbar[1]” block_name is “cflReg17” and register_name is “cflExceptionLeaf4”.
Example:
RP/0/RSP0/CPU0: AG2-10#sh logging | i ASIC

RP/0/RSP0/CPU0:May 11 20:48:57.658 IST: fab_xbar[184]: %PLATFORM-CIH-5-ASIC_ERROR_THRESHOLD :
 sfe[0]: An interface-err error has occurred causing  packet drop transient.
 ibbReg13.ibbExceptionHier.ibbReg13.ibbExceptionLeaf0.intIpcFnc0UcDataErr  Threshold has been exceeded

RP/0/RSP0/CPU0: AG2-10#sh controllers fabric crossbar link-status instance 0 location 0/rsp0/CPU0

PORT    Remote Slot  Remote Inst    Logical ID  Status

======================================================

04      0/0/CPU0            00             1        Up

06      0/0/CPU0            00             0        Up

08      0/7/CPU0            00             1        Up

10      0/7/CPU0            00             0        Up

24      0/2/CPU0            00             0        Up

26      0/2/CPU0            00             1        Up
 >>> ibbReg13 >> 13*2 = 26 SO IT IS POINTING TO LC2 – IN THIS CASE YOU CAN DO OIR TO RECOVER THE ASIC ERROR

40      0/RSP0/CPU0         00             0        Up

RP/0/RSP0/CPU0: AG2-10#show controllers asic SKB-XBAR instance 0 block-name ibbReg13 register-name ibbExceptionLeaf0 location 0/RSP0/CPU0

address   name                value

0x00050d080  SkyboltRegisters_ibbReg13_ibbExceptionLeaf0_int1Stat 0x00000000 (4 bytes)

address   name                value

0x00050d084  SkyboltRegisters_ibbReg13_ibbExceptionLeaf0_int1StatRw1s 0x00000000 (4 bytes)

address   name                value

0x00050d088  SkyboltRegisters_ibbReg13_ibbExceptionLeaf0_int1Enable 0xfffffffb (4 bytes)

address   name                value

0x00050d08c  SkyboltRegisters_ibbReg13_ibbExceptionLeaf0_int1First 0x00000000 (4 bytes)

address   name                value

0x00050d090  SkyboltRegisters_ibbReg13_ibbExceptionLeaf0_int2Stat 0x00000c50 (4 bytes)

address   name                value

0x00050d094  SkyboltRegisters_ibbReg13_ibbExceptionLeaf0_int2StatRw1s 0x00000c50 (4 bytes)

address   name                value

0x00050d098  SkyboltRegisters_ibbReg13_ibbExceptionLeaf0_int2Enable 0x00000000 (4 bytes)

address   name                value

0x00050d09c  SkyboltRegisters_ibbReg13_ibbExceptionLeaf0_int2First 0x00000000 (4 bytes)

address   name                value

0x00050d0a0  SkyboltRegisters_ibbReg13_ibbExceptionLeaf0_haltEnable 0x00000000 (4 bytes)

address   name                value

0x00050d0a4  SkyboltRegisters_ibbReg13_ibbExceptionLeaf0_fault 0x00000000 (4 bytes)

address   name                value

0x00050d0a8  SkyboltRegisters_ibbReg13_ibbExceptionLeaf0_intMulti 0x00000840 (4 bytes)

address   name                value

0x00050d0ac  SkyboltRegisters_ibbReg13_ibbExceptionLeaf0_leaf 0x00000000 (4 bytes)

RP/0/RSP0/CPU0:AG2-10#
Arbiter Fault Triage
In order to check the link status:
RP/0/RSP0/CPU0:AG2-10#sho controllers fabric arbiter link-status location 0/1/$

Port    Remote Slot  Remote Elem    Remote Inst  Status

=======================================================

00      0/1/CPU0            FIA            0        Up

01      0/1/CPU0            FIA            1        Up

24      0/RSP0/CPU0         ARB            0        Up

25      0/RSP1/CPU0         ARB            0        Up
In order to check VQI availability:
RP/0/RP0/CPU0:AG3_1#sh controllers fabric vqi assignment all

Current mode: Highbandwidth mode - 2K VQIs

Node          Number of VQIs

----------------------------

0/0/CPU0       80

0/1/CPU0       40

0/2/CPU0       48

0/3/CPU0       80

0/5/CPU0       80

0/7/CPU0       80

0/12/CPU0      64

RP*/RSP*       8

----------------------------

In Use   =      480

Available =    1568
Check the speed assigned to VQI:
RP/0/RP0/CPU0:AG3_1#sh controller fabric vqi assignment slot 7

Thu May 12 07:58:59.897 EDT

 slot = 7

 fia_inst = 0

 VQI = 400      SPEED_100G

 VQI = 401      SPEED_100G

 VQI = 402      SPEED_100G

 VQI = 403      SPEED_100G

 VQI = 404      SPEED_100G

 VQI = 405      SPEED_100G

 VQI = 406      SPEED_100G

slot = 7

 fia_inst = 1

 VQI = 416      SPEED_40G

 VQI = 417      SPEED_40G

 VQI = 418      SPEED_40G

 VQI = 419      SPEED_40G

 VQI = 420      SPEED_100G
If you observe any tail drops on FIA, check these steps:
Check for queue depth in VQI:
RP/0/RP0/CPU0:AG3_1#show controllers fabric fia q-depth location 0/0/CPU0

Thu May 12 08:00:42.186 EDT

 ********** FIA-0 **********

Category: q_stats_a-0

Voq       ddr            pri            Cellcnt   Slot_FIA_NP

28        0              2              2         LC0_1_1

 ********** FIA-0 **********

Category: q_stats_b-0

Voq       ddr            pri            Cellcnt   Slot_FIA_NP

 ********** FIA-1 **********

Category: q_stats_a-1

Voq       ddr            pri            Cellcnt   Slot_FIA_NP

7         0              2              12342         LC0_0_0
 >>> Here Packet count is high so we need to check for LC0 FIA0 NP0 (egress) is there any congestion
 or any other issue in LC0 FIA0 or NP0

Here Pri = 2 is the default queue (BE) , Pri = 0 is P1 (Voice, real time) queue, Pri = 1 is P2

97        0              2                23           LC1_0_0
RP/0/RP0/CPU0:AG3_1#show controllers fabric vqi assignment slot 02

 slot = 2

 fia_inst = 0

 VQI = 0        SPEED_10G

 VQI = 1        SPEED_10G

 VQI = 2        SPEED_10G

 VQI = 3        SPEED_10G

 VQI = 4        SPEED_10G

 VQI = 5        SPEED_10G

 VQI = 6        SPEED_10G

 VQI = 7        SPEED_10G
Port mapping details for the VQI:
RP/0/RP0/CPU0:AG3_1#show controllers pm vqi location 0/0/CPU0

Platform-manager VQI Assignment Information

      Interface Name      | ifh Value | VQI | NP#

--------------------------------------------------

         TenGigE0_0_0_0_1 | 0x4000680 |   1 |   0

         TenGigE0_0_0_0_2 | 0x40006c0 |   2 |   0

         TenGigE0_0_0_0_3 | 0x4000700 |   3 |   0

         TenGigE0_0_0_0_4 | 0x4000740 |   4 |   0

         TenGigE0_0_0_0_5 | 0x4000780 |   5 |   0

         TenGigE0_0_0_0_6 | 0x40007c0 |   6 |   0

         TenGigE0_0_0_0_7 | 0x4000800 |   7 |   0
RP/0/RP0/CPU0:AG3_1#show controllers pm interface tenGigE 0/0/0/0/7

Ifname(1): TenGigE0_0_0_0_7, ifh: 0x4000800 :

iftype             0x1e

egress_uidb_index  0x12, 0x0, 0x0, 0x0

ingress_uidb_index 0x12, 0x0, 0x0, 0x0

port_num           0x0

subslot_num        0x0

ifsubinst          0x0

ifsubinst port     0x7

phy_port_num       0x7

channel_id         0x0

channel_map        0x0

lag_id             0x7e

virtual_port_id    0xa

switch_fabric_port 7     >>> VQI matching for the ports

in_tm_qid_fid0     0x38001e

in_tm_qid_fid1     0x0

in_qos_drop_base   0xa69400

out_tm_qid_fid0    0x1fe002

out_tm_qid_fid1    0xffffffff

np_port            0xd3
Logs collection:
Show tech fabric

Show tech np

show controllers pm trace ?

  async        Platform manager async trace

  creation     Platform manager interface creation/deletion trace

  error        Platform manager error trace

  information  Platform manager information trace

  init         Platform manager init trace

  other        Platform manager common trace

  stats        Platform manager stats trace
NP Fault Triage
NP load verification:
RP/0/RP0/CPU0:AG3_1#show controller np load all location 0/0/CPU0

                Node: 0/0/CPU0:

----------------------------------------------------------------

           Load                Packet Rate

  NP0:  2% utilization         3095766 pps

  NP1:  3% utilization         5335675 pps

  NP2:  0% utilization             498 pps

  NP3:  0% utilization            1117 pps
Port mapping:
RP/0/RP0/CPU0:AG3_1#show controllers np ports all location 0/0/CPU0

                Node: 0/0/CPU0:

----------------------------------------------------------------


NP Bridge Fia                       Ports

-- ------ --- ---------------------------------------------------

0  --     0   TenGigE0/0/0/0/0 - TenGigE0/0/0/0/9, TenGigE0/0/0/1/0 - TenGigE0/0/0/1/9

1  --     1   TenGigE0/0/0/2/0 - TenGigE0/0/0/2/9, HundredGigE0/0/0/3

2  --     2   HundredGigE0/0/0/4 - HundredGigE0/0/0/5

3  --     3   HundredGigE0/0/0/6 - HundredGigE0/0/0/7
Tomahawk
Note this is admin mode:
sysadmin-vm:0_RP0# show controller switch statistics location 0/LC0/LC-SW

Thu May  12 12:32:37.160 UTC+00:00

Rack  Card  Switch  Rack Serial Number

--------------------------------------

0     LC0   LC-SW
                                              Tx      Rx

      Phys   State                            Drops/  Drops/

Port  State  Changes  Tx Packets  Rx Packets  Errors  Errors  Connects To

----------------------------------------------------------------------------

0     Up     2        3950184361  3977756349  0       0       NP0

1     Up     2        0           0           0       0       NP0

8     Up     1        1319787462  209249871   0       0       LC CPU N0 P0

9     Up     1        3374323096  1819796660  0       0       LC CPU N0 P1

16    Up     2        2245174606  1089972811  0       0       NP1

17    Up     2        0           0           0       0       NP1

18    Up     2        65977       16543963    0       0       NP2

19    Up     2        0           0           0       0       NP2

32    Up     2        128588820   3904804720  0       0       NP3

33    Up     2        0           0           0       0       NP3
show asic-error np <> all loc <>   >>> Ignore the macwrap errors as they are seen for every
 interface flaps/ Execute 3-4 times to verify the drops increment
show controller np fast-drop <> loc <> >>> Execute 3-4 times to verify the drops increment
RP/0/RP0/CPU0:AG3_1#show controller np fast-drop  np0 location 0/0/CPU0

Thu May 12 10:13:22.981 EDT

                Node: 0/0/CPU0:

----------------------------------------------------------------

All fast drop counters for NP 0:

 TenGigE0/0/0/1/0-TenGigE0/0/0/1/9:[Priority1]    0

 TenGigE0/0/0/1/0-TenGigE0/0/0/1/9:[Priority2]    0

 TenGigE0/0/0/1/0-TenGigE0/0/0/1/9:[Priority3]    0

 TenGigE0/0/0/0/0-TenGigE0/0/0/0/9:[Priority1]    0

 TenGigE0/0/0/0/0-TenGigE0/0/0/0/9:[Priority2]    0

 TenGigE0/0/0/0/0-TenGigE0/0/0/0/9:[Priority3]    0
show controllers np punt-path-counters all HOST-IF-0 np<> location <>
 [Check for IF_CNT_RX_FRM & IF_CNT_TX_FRM] >>> To check if diagnostic packets make it to the LC NP
 Host CPU network port
Lightspeed
show asic-error np <> all loc <> >>> Ignore the macwrap errors as they are seen for every interface flap
RP/0/RP0/CPU0:AG3_1#sho asic-errors np 0 all location 0/5/CPU0

************************************************************

*                         0_5_CPU0                         *

************************************************************

************************************************************

*                    Single Bit Errors                     *

************************************************************

************************************************************

*                   Multiple Bit Errors                    *

************************************************************

************************************************************

*                      Parity Errors                       *

************************************************************

************************************************************

*                      Generic Errors                      *

************************************************************

ASR, ASR9K Lightspeed 20*100GE SE LC, 0/5/CPU0, npu[0]

Name            : mphmacwrapReg1.mphmacwrapExceptionLeaf4.mphWrapIrqUmacIpInt82

Leaf ID         : 0x2023e082

Error count     : 1

Last clearing   : Thu Apr  7 11:41:47 2022

Last N errors   : 1

--------------------------------------------------------------

First N errors.

@Time, Error-Data

------------------------------------------
show controller np fast-drop <> loc <> >>> Execute 3-4 times to verify the drops increment
RP/0/RP0/CPU0:AG3_1#show controller np fast-drop  np0 location 0/5/CPU0

Thu May 12 10:13:28.321 EDT

                Node: 0/5/CPU0:

----------------------------------------------------------------

All fast drop counters for NP 0:

 HundredGigE0_5_0_0[Crit]                      0

 HundredGigE0_5_0_0[HP]                        0

 HundredGigE0_5_0_0[LP2]                       0

 HundredGigE0_5_0_0[LP1]                       0

 HundredGigE0_5_0_0[Crit+HP_OOR]               0

 HundredGigE0_5_0_0[LP2+LP1_OOR]               0

 HundredGigE0_5_0_1[Crit]                      0

 HundredGigE0_5_0_1[HP]                        0

 HundredGigE0_5_0_1[LP2]                       0

 HundredGigE0_5_0_1[LP1]                       0

 HundredGigE0_5_0_1[Crit+HP_OOR]               0
Note this is admin mode:
sysadmin-vm:0_RP0# show controller switch statistics location 0/LC5/LC-SW   >>> Execute 3-4
 times to verify the errors increment

Rack  Card  Switch  Rack Serial Number

--------------------------------------

0     LC5   LC-SW

                                              Tx      Rx

      Phys   State                            Drops/  Drops/

Port  State  Changes  Tx Packets  Rx Packets  Errors  Errors  Connects To

-----------------------------------------------------------------------------

0     Up     4        1456694749  329318054   0       4       CPU -- EOBC

1     Up     2        21          23          0       0       CPU -- flexE

2     Up     4        1063966999  87683758    0       0       CPU -- PUNT

3     Up     4        885103800   3021484524  0       0       CPU -- BFD

4     Up     3        329319167   1456700372  0       0       RP0

5     Up     3        0           0           0       0       RP1

6     Up     1        11887785    2256        0       0       IPU 0

7     Up     1        0           1086        0       0       IPU 1

9     Up     4        74028034    3025657779  0       0       NP0

10    Up     4        5           0           0       0       NP0

11    Down   1        0           0           0       0       PHY0 -- flexE

12    Up     4        264928      264929      0       0       NP1

13    Up     2        5           0           0       0       NP1

14    Down   1        0           0           0       0       PHY1 -- flexE

15    Up     4        1516538834  1159586563  0       0       NP2
Log Collection:
show tech np
show tech fabric
show asic-errors fia trace all location <>
- In eXR , collect the np_datalog:
RP/0/RP0/CPU0:AG3_1#run chvrf 0 ssh lc0_xr

LC : [one time capture]

show_np -e <> -d npdatalog [<> should be the affected NP]

Path where NP datalogs is saved : /misc/scratch/np/NPdatalog_0_0_CPU0_np0_prm__20220512-105332.txt.gz

LC : 5 to 10 times

show_np -e <> -d pipeline [<> should be the affected NP]
- For NP Init Failure on LSP:
RP/0/RP0/CPU0:AG2-2#show controllers np ports all location 0/6/CPU0

Node: 0/6/CPU0:
----------------------------------------------------------------
NP Bridge Fia                       Ports
-- ------ --- ---------------------------------------------------

0  --     0   HundredGigE0/6/0/0 - HundredGigE0/6/0/31  --

1 --      1   HundredGigE0/6/0/4 - HundredGigE0/6/0/7

NP2 is down. >>>>>>>>>. NP Down/Init Failure

3 --      3   HundredGigE0/6/0/12 - HundredGigE0/6/0/154  --

4 --      4  HundredGigE0/6/0/16 - HundredGigE0/6/0/19
These logs observe:
LC/0/6/CPU0:Mar 23 02:53:56.175 IST: npu_server_lsp[138]: %PLATFORM-LDA-3-INIT_FAIL :
 Failed to initialize lda_bb_np_reset_process 13795 inst 0x2 LC INIT: Failed in NP HAL
 Reset np  (0x00000001 - Operation not permitted)  : npu_server_lsp : (PID=4597) :
  -Traceback= 7fea2d5cd9f6 7fea2d7d5816 7fea21465efa 7fea21465fc2 7fea42ad0bed 55a9dbd66031
 7fea45e1c855 7fea45e1cc2b 7fea2624d526 7fea3571b96a 7fea4d6e4831 55a9dbd691e9
LC/0/6/CPU0:Mar 23 02:53:56.185 IST: npu_server_lsp[138]: %PLATFORM-NP-4-INIT_DEBUG_MSG :
 LDA NP2 Reset failed!!  Check for a downlevel IPU version.
Log Collection:
show tech-support ethernet interfaces
show tech-support ethernet controllers
show tech-support np
show tech-support fpd
admin show tech-support ctrace (in eXR)
show tech fabric
show asic-errors fia trace all location <>
show logging

gather (in eXR)
RP/0/RP0/CPU0:AG3_1#admin
sysadmin-vm:0_RP0#
[sysadmin-vm:0_RP0:~]$bash -l
[sysadmin-vm:0_RP0:~]$ gather

File will be generated and will get saved in rp0_xr:/misc/disk1
General Log Collection for Tomahawk, LSQ, and LSP
show platform
show inventory
show tech fabric
show tech np
show tech ethernet interface
show logging
show pfm location all
show pfm trace location <location id>
sh pfm process <> location <>
show controllers pm vqi location all
show hw-module fpd location all (cxr) / admin show hw-module fpd (exr)
show controllers fti trace <process-name> location <card location>

Cxr:
From admin:
show logging onboard common location <>
show logging onboard error location <>
Exr:
From sysadmin/calvados:
show logging onboard fabric location <>"
Common Error Signature and Recommendation
|
Category |
Error |
Observations |
Recommendation |
|
NP Init failure |
LC/0/0/CPU0:Sep 29 00:41:13.171 IST: pfm_node_lc[304]: %PLATFORM-NP-1-NP_INIT_FAIL_NO_RESET: Set|prm_server_ty[168018]|0x1008006|Persistent NP initialization failure, line card reload not required. |
NP can go into NP init persistent error due to HW parity/TCAM error which forces NP to go down. |
LC Reload through CLI to recover. |
|
The issue can recover if transient in nature after the first reload of LC. |
Complete a Return Material Authorization (RMA) for repeat instances of the same error. |
||
|
RMA if repeat instances are seen. (capture a photo of the faulty board to inspect for damage/bent pins in SR). |
|||
|
The new card can face the same issue due to wrong field handling. |
|||
|
Interface mapped to NP stays down / No impact. |
|||
|
ASIC FATAL FAULT-Double bit ECC error |
LC/0/8/CPU0:May 29 18:29:09.836 IST: pfm_node_lc[301]: %FABRIC-FIA-0-ASIC_FATAL_FAULT : Set|fialc[159811]|0x108a000|Fabric interface asic ASIC0 encountered fatal fault 0x1 - DDR DOUBLE ECC ERROR |
This is a double-bit ECC error on FIA is a Hard error. |
HW error on FIA. |
|
The error can resurface and hence admin shut of LC is recommended. |
RMA the card. |
||
|
Interface mapped to NP/FIA stays down / No impact. |
|||
|
The issue is seen in one of the cases when FIA came up with the fib_mgr process block. |
|||
|
SERDES error |
•RP/0/RSP1/CPU0:Apr 17 12:22:10.690 IST: pfm_node_rp[378]: %PLATFORM-CROSSBAR-1-SERDES_ERROR_LNK0 : Set|fab_xbar[209006]|0x101702f|XBAR_1_Slot_1 |
Fabric error on LC fabric or RSP fabric |
LC Reload through CLI in order to recover the transient / CRC error for repetitive error. |
|
DATA_NB_SERDES_1_FAIL_0 |
LC/0/3/CPU0:Apr 10 18:55:03.213 IST: pfm_node_lc[304]: %FABRIC-FIA-1-DATA_NB_SERDES_1_FAIL_0 : Set|fialc[168004]|0x103d001|Data NB Serdes Link 1 Failure on FIA 1 RP/0/RSP0/CPU0:Apr 10 18:55:13.043 IST: FABMGR[227]: %PLATFORM-FABMGR-2-FABRIC_INTERNAL_FAULT: 0/3/CPU0 (slot 3) encountered fabric fault. Interfaces are going to be shutdown. |
Interface retrain mechanism to auto-recover the SERDES error on fabric. In case of an HW issue, the error can resurface on LC or RSP again. The interface stays up / frequent errors on SERDES impacted the traffic. |
RMA for repeat instances after OIR. |
|
ASIC INIT Errors |
•LC/0/6/CPU0:Jul 17 00:01:40.738 2019:pfm_node_lc[301]: %FABRIC-FIA-1-ASIC_INIT_ERROR : Set|fialc[168003]|0x108a000|ASIC INIT Error detected on FIA instance 0 |
FIA instance down event for any of the FIA on LC with ASIC INIT ERROR in Syslog. |
LC Reload through CLI to rule out any transient issue. |
|
FIA ASIC FATAL error (TS_NI_INTR_LCL_TIMER_EXPIRED) |
LC/0/19/CPU0:Mar 8 04:52:29.020 IST: pfm_node_lc[301]: %FABRIC-FIA-0-FATAL_INTERRUPT_ERROR : Set|fialc[172098]|0x108a003|FIA fatal error interrupt on FIA 3: TS_NI_INTR_LCL_TIMER_EXPIRED |
For the new card, it is seen that the unit has been mishandled at the time of shipment / installation causing physical damage to the board. A few boards did not exhibit any physical damage, but a solder crack was observed during EFA. That indicates overstrain on the package and possible malfunction over time. The interface stays up / frequent errors on SERDES impacted the traffic. |
If the problem persists, proceed with RMA / R&R. |
|
NP fast reset (Tomahawk ) |
LC/0/4/CPU0:Jul 6 04:06:49.259 IST: prm_server_ty[318]: %PLATFORM-NP-3-ECC : prm_ser_check: Completed NP fast reset to successfully recover from a soft error on NP 1. No further corrective action is required. |
NP detects the soft parity issue and tries to fix it by attempting the NP fast reset. |
No RMA for the first occurrence. |
|
NP parity LC reload |
LC/0/6/CPU0:Jan 27 20:38:08.011 IST: prm_server_to[315]: %PLATFORM-NP-0-LC_RELOAD: NP3 had 3 fast resets within an hour, initiating NPdatalog collection and automatic LC reboot |
Usually, after three recovery attempts, the LC reload by itself for fixing the parity issue on NP usually seen for the Tomahawk card. LC takes auto-recovery action by reloading the LC and fixing the soft non-recoverable parity issue in the reported NP. Interface mapped to NP goes down with reset / No impact. |
RMA for repeat instances of the same error. |
|
LC_NP_LOOPBACK_FAILED |
LC/0/1/CPU0:Jul 26 17:29:06.146 IST: pfm_node_lc[304]: %PLATFORM-DIAGS-0-LC_NP_LOOPBACK_FAILED_TX_PATH : Set|online_diag_lc[168022]|Line card NPU loopback Test(0x2000006)|link failure mask is 0x1. |
LC NP loopback diag test failure on one of the NP. |
LC Reload through CLI to rule out any transient issue. |
|
Alarm set in PFM as “LC_NP_LOOPBACK_FAILED_XX_PATH". |
RMA for repeat instances of the same error. |
||
|
Interface mapped to NP goes down with reset / No impact. |
|||
|
FABRIC-FIA-1-SUSTAINED_CRC_ERR |
LC/0/5/CPU0:Mar 6 05:47:34.748 IST: pfm_node_lc[303]: %FABRIC-FIA-1-SUSTAINED_CRC_ERR : Set|fialc[168004]|0x103d000|Fabric interface ASIC-0 has sustained CRC errors |
Fia shutdown due to FABRIC FIA SUSTAINED CRC error. |
LC Reload through CLI to rule out any transient issue. |
|
With FIA shutdown event, the interface on the FIA also goes down. |
RMA for repeat instances of the same error. |
||
|
The interface stays up / No impact. |
|||
|
FAB ARB XIF1 ERR |
•LC/0/6/CPU0:Jan 25 19:31:22.787 IST: pfm_node_lc[302]: %PLATFORM-FABARBITER-1-RX_LINK_ERR : Clear|fab_arb[163918]|0x1001001|LIT_XIF1_K_CHAR_ERR LC/0/6/CPU0:Jan 25 19:31:22.787 IST: pfm_node_lc[302]: %PLATFORM-FABARBITER-1-SYNC_ERR : Clear|fab_arb[163918]|0x1001001|LIT_XIF1_LOSS_SYNC LC/0/6/CPU0:Jan 25 19:33:23.010 IST: pfm_node_lc[302]: %PLATFORM-FABARBITER-1-RX_LINK_ERR : Set|fab_arb[163918]|0x1001001|LIT_XIF1_DISP_ERR |
PUNT error for LC & Fabric arbiter sync & rx_link error. The interface stays up / No impact. |
OIR the card to rule out any transient issue. RMA for repeat instances of the same error. |
|
FPOE_read_write error |
xbar error trace (show tech fabric) |
Cisco bug ID CSCvv45788 |
Software defect |
|
FIA_XBAR SERDES |
#show controller fabric fia link-status location 0/9/CPU0 |
OIR the card to rule out any transient issue. RMA for repeat instances of the same error. |
|
|
NP DIAG ICFD fast reset |
NP-DIAG on NP0, ICFD (STS-1), NP can be 0-4 NP3 had 3 fast resets within an hour, initiating NPdatalog collection and automatic LC reboot |
Triggers a FAST reset of NP And LC reloads if 3 NP fast resets in an hour. |
If LC reloads multiple times, RMA. |
|
PRM health monitoring failed to get packet NP fast resets |
NP-DIAG health monitoring failure NP3 had 3 fast resets within an hour, initiating NPdatalog collection and automatic LC reboot |
Triggers a FAST reset of NP And LC reloads if 3 NP fast resets in an hour. |
If LC reloads multiple times, RMA. |
|
PRM health monitoring gets corrupted packet-NP fast resets |
NP-DIAG health monitoring corruption on NP3 had 3 fast resets within an hour, initiating NPdatalog collection and automatic LC reboot |
Triggers a FAST reset of NP And LC reloads if 3 NP fast resets in an hour. |
If LC reloads multiple times, RMA. |
|
Top inactivity failure |
NP-DIAG failure on NP Interrupt from Ucode on Top inactivity - does NP fast resets |
Triggers a FAST reset of NP And LC reloads if 3 NP fast resets in an hour. |
If LC reloads multiple times, RMA. |
|
LSP NP Init Failure |
LC/0/6/CPU0:Mar 23 02:53:56.175 IST: npu_server_lsp[138]: %PLATFORM-LDA-3-INIT_FAIL : Failed to initialize lda_bb_np_reset_process 13795 inst 0x2 LC INIT: Failed in NP HAL Reset np (0x00000001 - Operation not permitted) : npu_server_lsp : (PID=4597) : -Traceback= 7fea2d5cd9f6 7fea2d7d5816 7fea21465efa 7fea21465fc2 7fea42ad0bed 55a9dbd66031 7fea45e1c855 7fea45e1cc2b 7fea2624d526 7fea3571b96a 7fea4d6e4831 55a9dbd691e9 |
This information needs to be gathered:
File is generated and gets saved in rp0_xr:/misc/disk1
|
LC Reload through CLI to rule out any transient issue. |
|
Tomahawk NP Init Failure (DDR training FAIL) |
+++ show prm server trace error location 0/7/CPU0 [14:36:59.520 IST Sat Jan 29 2022] ++++ 97 wrapping entries (2112 possible, 320 allocated, 0 filtered, 97 total) Jan 29 00:22:10.135 prm_server/error 0/7/CPU0 t10 prm_np_Channel_PowerUp : 0x80001d46 Error powering channel 3 phase 4 Jan 29 00:22:10.136 prm_server/error 0/7/CPU0 t10 np_thread_channel_bringup : 0xa57c0200 Power phase 4 failed on channel 3 Jan 29 00:22:10.136 prm_server/error 0/7/CPU0 t10 np_thread_channel_bringup NP3 has failed to boot, trying again. Retry number 1 Jan 29 00:22:35.125 prm_server/error 0/7/CPU0 t10 prm_np_Channel_PowerUp : 0x80001d46 Error powering channel 3 phase 4 Jan 29 00:22:35.125 prm_server/error 0/7/CPU0 t10 np_thread_channel_bringup : 0xa57c0200 Power phase 4 failed on channel 3 Jan 29 00:22:35.125 prm_server/error 0/7/CPU0 t10 np_thread_channel_bringup NP3 has failed to boot, trying again. Retry number 2 Jan 29 00:22:59.075 prm_server/error 0/7/CPU0 t10 prm_np_Channel_PowerUp : 0x80001d46 Error powering channel 3 phase 4 Jan 29 00:22:59.075 prm_server/error 0/7/CPU0 t10 np_thread_channel_bringup : 0xa57c0200 Power phase 4 failed on channel 3 Jan 29 00:22:59.075 prm_server/error 0/7/CPU0 t10 np_thread_channel_bringup After 3 attempt(s), NP3 has failed to initialize. Jan 29 00:23:00.087 prm_server/error 0/7/CPU0 t10 prm_send_pfm_msg: Persistent NP initialization failure, linecard reload not required. Check in NP Driver logs <NP#3>DDR training FAIL (status 0x1) <NP#3>ddr3TipRunAlg: tuning failed 0 <NP#3>ddrTipRunAlgo opcode: ddr3TipRunAlg failed (error 0x1) <NP#3>*** Error: Un-known 0x1 |
node: node0_7_CPU0 Jan 29 00:22:58|8 |NP_INIT_FAIL_NO_RESET |E/A|5356 |Network Proces|0x1008000 |
LC Reload through CLI to rule out any transient issue. If the issue still observe RMA the LC Cisco bug ID CSCwa85165 |
|
LSP NP Init Failure (HbmReadParticleError error) |
LC/0/13/CPU0:Jan 10 13:34:59.106 IST: npu_server_lsp[278]: %PLATFORM-NP-4-SHUTDOWN_START : NP4: EMRHIMREG.ch1Psch0HbmReadParticleError error detected, NP shutdown in progress LC/0/13/CPU0:Jan 10 13:34:59.106 IST: pfm_node_lc[330]: %PLATFORM-NP-0-UNRECOVERABLE_ERROR : Set|npu_server_lsp[4632]|0x10a5004|A non-recoverable error has been detected on NP4 |
+++ show controllers np interrupts all all location 0/13/CPU0 [16:02:16.712 IST Mon Jan 10 2022] ++++ Node: 0/13/CPU0: ---------------------------------------------------------------- NPU Interrupt Name Id Cnt --- ------------------------------------------------------------------------------------------ -------------- ------- <snip> 4 hbmdpReg0.hbmdpExceptionLeaf0.hbmdpIntNwlHbmdpRdDataUncorrectableErrCh1Psch1 0x201dc013 1 4 hbmdpReg0.hbmdpExceptionLeaf0.hbmdpIntNwlHbmdpRdDataUncorrectableErrCh1Psch0 0x201dc012 1 |
Verify Cisco bug ID CSCvt59803 is installed. LC reload through CLI helps to recover. |
|
Arbitor Link Down with Standby |
Fabric-Manager: |
OIR the card to rule out any transient issue. RMA for repeat instance of same error. |
|
|
Serdes Error |
show serdes trace location 0/X/CPU0 | i "HTL_ERR_DEVICE_NOT_CONNECTED"') you see these errors: |
Cisco bug ID CSCvz75552 |
Software Defect |
Known Defects
| Cisco bug ID | Component | Title |
| Cisco bug ID CSCvy00012 | asr9k-diags-online | Packet memory exhaustion by online_diag_rsp |
| Cisco bug ID CSCvw57721 | asr9k-servicepack | Umbrella SMU containing updated firmware for Lightspeed NP and arbiter serdes |
| Cisco bug ID CSCvz75552 | asr9k-vic-ls | Phy firmware hangs and causes optics to not get recognized on A9K-20HG-FLEX |
| Cisco bug ID CSCvz76691 | asr9k-servicepack | Umbrella SMU with improved link status interrupt handling for Tomahawk linecards |
| Cisco bug ID CSCvz84139 | asr9k-ls-fabric | fab_si crash when router upgraded to 742 |
| Cisco bug ID CSCwa81006 | asr9k-pfm | ASR9K/eXR unable to commit fault-manager datapath port shutdown in some scenarios |
| Cisco bug ID CSCvz16840 | asr9k-fia | BLB sessions flap when CLI reload LC because forwarding path shut early due to changes added in 6.5.2 |
| Cisco bug ID CSCwb64255 | asr9k-fab-xbar | new SI settings for SKB in Starscream(9912) and Megatron(9922) chassis |
| Cisco bug ID CSCwa09794 | asr9k-fab-xbar | new SI after fine-tuning for RO chassis for SKB-SM15 |
| Cisco bug ID CSCvv45788 | asr9k-fab-xbar | fab_xbar and mgid-programmer processes accessing hw at the same time |
| Cisco bug ID CSCwd22196 | asr9k-prm | RFD buffer exhaustion between ILKN link on Tomahawk LC |
| Cisco bug ID CSCwb66960 | asr9k-fab-infra | ASR9k punt fabric fault isolation |
| Cisco bug ID CSCwa79758 | asr9k-fab-xbar | Multicast loss on LSP LC after doing OIR of another LSP LC with XBAR link fault |
| Cisco bug ID CSCvw88284 | asr9k-lda-ls | RSP5 BW to default to 200G on 9910/9906 chassis instead of 600G. |
| Cisco bug ID CSCvm82379 | asr9k-fab-arb | fab-arb crashed while taking sh tech fabric |
| Cisco bug ID CSCvh00349 | asr9k-fia | ASR9k fabric can handle ucast packets sent while on standby |
| Cisco bug ID CSCvk44688 | asr9k-fia | FPGA had errors repeatedly and it could not recover |
| Cisco bug ID CSCvy31670 | asr9k-ls-fia | LSP: Removing FC0 enables the fabric rate limiter, FC4 does not |
| Cisco bug ID CSCvt59803 | asr9k-ls-npdriver | LSP: PLATFORM-NP-4-SHUTDOWN IMRHIMREG.ch1Psch1HbmReadParticleError |
Behavior of fault-manager datapath port shutdown/toggle Command
- The
fault-manager datapath port shutdowncommand helps shut down the ports of respective FIA/NP for which the Punt Datapath Failure alarm is set, on Active RP/RSP, and the interface does not come up automatically until you reload the LC. This CLI command does not work as expected from the 7. x.x release. (CLI commandfault-manager datapath port shutdownis not working as per design from 7. x.x) - fixed in 7.7.2. - The
fault-manager datapath port toggleCLI command works fine. It opens the port once the Punt Datapath Failure alarm is clear. - This helps to prevent a service outage if proper link-level redundancy and BW availability on the redundant path is available.
Testing - to validate the previously mentioned command operation.
Inducing PUNT error generation on NP0 LC7:
RP/0/RP0/CPU0:ASR-9922-A#monitor np counter PUNT_DIAGS_RSP_ACT np0 count 20 location 0/7/CPU0

Wed Jul  7 14:15:17.489 UTC


Usage of NP monitor is recommended for cisco internal use only.

Please use instead 'show controllers np capture' for troubleshooting packet drops in NP

and 'monitor np interface' for per (sub)interface counter monitoring


Warning: Every packet captured will be dropped! If you use the 'count'

         option to capture multiple protocol packets, this could disrupt

         protocol sessions (eg, OSPF session flap). So if capturing protocol

         packets, capture only 1 at a time.


Warning: A mandatory NP reset will be done after monitor to clean up.

         This will cause ~150ms traffic outage. Links will stay Up.

 Proceed y/n [y] > y

 Monitor PUNT_DIAGS_RSP_ACT on NP0 ... (Ctrl-C to quit)


Wed Jul  7 14:17:08 2021 -- NP0 packet


 From Fabric: 127 byte packet

0000: 00 09 00 00 b4 22 00 00 ff ff ff ff 00 00 ff ff   ....4"..........

0010: 00 ff 00 ff f0 f0 f0 f0 cc cc cc cc aa aa aa aa   ....ppppLLLL****

0020: 55 55 55 55 00 00 00 00 01 00 00 00 00 00 00 00   UUUU............

0030: 00 00 00 00 ff ff ff ff 00 00 ff ff 00 ff 00 ff   ................

0040: f0 f0 f0 f0 cc cc cc cc aa aa aa aa 55 55 55 55   ppppLLLL****UUUU

0050: 00 00 00 00 01 00 00 00 00 00 00 00 00 00 00 00   ................

0060: ff ff ff ff 00 00 ff ff 00 ff 00 ff f0 f0 f0 f0   ............pppp

0070: cc cc cc cc aa aa aa aa 55 55 55 55 00 00 00      LLLL****UUUU...


                                    (count 1 of 20)

Wed Jul  7 14:18:09 2021 -- NP0 packet


 From Fabric: 256 byte packet

0000: 00 09 00 00 b5 22 00 00 ff ff ff ff 00 00 ff ff   ....5"..........

0010: 00 ff 00 ff f0 f0 f0 f0 cc cc cc cc aa aa aa aa   ....ppppLLLL****

0020: 55 55 55 55 00 00 00 00 01 00 00 00 00 00 00 00   UUUU............

0030: 00 00 00 00 ff ff ff ff 00 00 ff ff 00 ff 00 ff   ................

0040: f0 f0 f0 f0 cc cc cc cc aa aa aa aa 55 55 55 55   ppppLLLL****UUUU

0050: 00 00 00 00 01 00 00 00 00 00 00 00 00 00 00 00   ................

0060: ff ff ff ff 00 00 ff ff 00 ff 00 ff f0 f0 f0 f0   ............pppp

0070: cc cc cc cc aa aa aa aa 55 55 55 55 00 00 00 00   LLLL****UUUU....

0080: 01 00 00 00 00 00 00 00 00 00 00 00 ff ff ff ff   ................

0090: 00 00 ff ff 00 ff 00 ff f0 f0 f0 f0 cc cc cc cc   ........ppppLLLL

00a0: aa aa aa aa 55 55 55 55 00 00 00 00 01 00 00 00   ****UUUU........

00b0: 00 00 00 00 00 00 00 00 ff ff ff ff 00 00 ff ff   ................

00c0: 00 00 00 00 00 00 00 00 00 00 00 00 00 00 00 00   ................

00d0: 00 00 00 00 00 00 00 00 00 00 00 00 00 00 00 00   ................

00e0: 00 00 00 00 00 00 00 00 00 00 00 00 00 00 00 00   ................

00f0: 00 00 00 00 00 00 00 00 00 00 00 00 00 00 00 00   ................


                                    (count 2 of 20)

Wed Jul  7 14:19:09 2021 -- NP0 packet

Actual packet size 515 bytes truncated size 384:


 From Fabric: 384 byte packet

0000: 00 09 00 00 b6 22 00 00 ff ff ff ff 00 00 ff ff   ....6"..........

0010: 00 ff 00 ff f0 f0 f0 f0 cc cc cc cc aa aa aa aa   ....ppppLLLL****

0020: 55 55 55 55 00 00 00 00 01 00 00 00 00 00 00 00   UUUU............

0030: 00 00 00 00 ff ff ff ff 00 00 ff ff 00 ff 00 ff   ................

0040: f0 f0 f0 f0 cc cc cc cc aa aa aa aa 55 55 55 55   ppppLLLL****UUUU

0050: 00 00 00 00 01 00 00 00 00 00 00 00 00 00 00 00   ................

0060: ff ff ff ff 00 00 ff ff 00 ff 00 ff f0 f0 f0 f0   ............pppp

0070: cc cc cc cc aa aa aa aa 55 55 55 55 00 00 00 00   LLLL****UUUU....

0080: 01 00 00 00 00 00 00 00 00 00 00 00 ff ff ff ff   ................

0090: 00 00 ff ff 00 ff 00 ff f0 f0 f0 f0 cc cc cc cc   ........ppppLLLL

00a0: aa aa aa aa 55 55 55 55 00 00 00 00 01 00 00 00   ****UUUU........

00b0: 00 00 00 00 00 00 00 00 ff ff ff ff 00 00 ff ff   ................

00c0: 00 00 00 00 00 00 00 00 00 00 00 00 00 00 00 00   ................

00d0: 00 00 00 00 00 00 00 00 00 00 00 00 00 00 00 00   ................

00e0: 00 00 00 00 00 00 00 00 00 00 00 00 00 00 00 00   ................

00f0: 00 00 00 00 00 00 00 00 00 00 00 00 00 00 00 00   ................

0100: 00 00 00 00 00 00 00 00 00 00 00 00 00 00 00 00   ................

0110: 00 00 00 00 00 00 00 00 00 00 00 00 00 00 00 00   ................

0120: 00 00 00 00 00 00 00 00 00 00 00 00 00 00 00 00   ................

0130: 00 00 00 00 00 00 00 00 00 00 00 00 00 00 00 00   ................

0140: 00 00 00 00 00 00 00 00 00 00 00 00 00 00 00 00   ................

0150: 00 00 00 00 00 00 00 00 00 00 00 00 00 00 00 00   ................

0160: 00 00 00 00 00 00 00 00 00 00 00 00 00 00 00 00   ................

0170: 00 00 00 00 00 00 00 00 00 00 00 00 00 00 00 00   ................


RP/0/RP0/CPU0:ASR-9922-A#sh pfm location 0/RP0/CPU0

Wed Jul  7 14:19:17.174 UTC


node: node0_RP0_CPU0

---------------------

CURRENT TIME: Jul  7 14:19:17 2021

PFM TOTAL: 2   EMERGENCY/ALERT(E/A): 1   CRITICAL(CR): 0   ERROR(ER): 1

-------------------------------------------------------------------------------------------------

Raised Time         |S#|Fault Name                         |Sev|Proc_ID|Dev/Path Name |Handle

--------------------+--+-----------------------------------+---+-------+--------------+----------

Jul  1 10:13:45 2021|0 |SPINE_UNAVAILABLE                  |E/A|5082   |Fabric Manager|0x1034000

Jul  7 14:19:09 2021|0 |PUNT_FABRIC_DATA_PATH_FAILED       |ER |9429   |System Punt/Fa|0x2000004

RP/0/RP0/CPU0:ASR-9922-A#sh pfm process 9429 location 0/Rp0/CPU0

Wed Jul  7 14:19:37.128 UTC


node: node0_RP0_CPU0

---------------------

CURRENT TIME: Jul  7 14:19:37 2021

PFM TOTAL: 2   EMERGENCY/ALERT(E/A): 1   CRITICAL(CR): 0   ERROR(ER): 1

PER PROCESS TOTAL: 0   EM: 0   CR: 0   ER: 0

Device/Path[1 ]:Fabric loopbac  [0x2000003 ] State:RDY  Tot: 0

Device/Path[2 ]:System Punt/Fa  [0x2000004 ] State:RDY  Tot: 1

1   Fault Id:          432

    Sev:               ER

    Fault Name:        PUNT_FABRIC_DATA_PATH_FAILED

    Raised Timestamp:  Jul  7 14:19:09 2021

    Clear Timestamp:   N/A

    Changed Timestamp: N/A

    Resync Mismatch:   FALSE

    MSG:               failure threshold is 3, (slot, NP) failed: (0/7/CPU0, 0)

Device/Path[3 ]:Crossbar Switc  [0x108c000 ] State:RDY  Tot: 0

Device/Path[4 ]:Crossbar Switc  [0x108c001 ] State:RDY  Tot: 0

Device/Path[5 ]:Crossbar Switc  [0x108c002 ] State:RDY  Tot: 0

Device/Path[6 ]:Crossbar Switc  [0x108c003 ] State:RDY  Tot: 0

Device/Path[7 ]:Crossbar Switc  [0x108c004 ] State:RDY  Tot: 0

Device/Path[8 ]:Crossbar Switc  [0x108c005 ] State:RDY  Tot: 0

Device/Path[9 ]:Crossbar Switc  [0x108c006 ] State:RDY  Tot: 0

Device/Path[10]:Crossbar Switc  [0x108c007 ] State:RDY  Tot: 0

Device/Path[11]:Crossbar Switc  [0x108c008 ] State:RDY  Tot: 0

Device/Path[12]:Crossbar Switc  [0x108c009 ] State:RDY  Tot: 0

Device/Path[13]:Crossbar Switc  [0x108c00a ] State:RDY  Tot: 0

Device/Path[14]:Crossbar Switc  [0x108c00b ] State:RDY  Tot: 0

Device/Path[15]:Crossbar Switc  [0x108c00c ] State:RDY  Tot: 0

Device/Path[16]:Crossbar Switc  [0x108c00d ] State:RDY  Tot: 0

Device/Path[17]:Crossbar Switc  [0x108c00e ] State:RDY  Tot: 0

Device/Path[18]:Fabric Interfa  [0x108b000 ] State:RDY  Tot: 0

Device/Path[19]:Fabric Arbiter  [0x1086000 ] State:RDY  Tot: 0

Device/Path[20]:CPU Controller  [0x108d000 ] State:RDY  Tot: 0

Device/Path[21]:Device Control  [0x109a000 ] State:RDY  Tot: 0

Device/Path[22]:ClkCtrl Contro  [0x109b000 ] State:RDY  Tot: 0

Device/Path[23]:NVRAM           [0x10ba000 ] State:RDY  Tot: 0

Device/Path[24]:Hooper switch   [0x1097000 ] State:RDY  Tot: 0

Device/Path[25]:Hooper switch   [0x1097001 ] State:RDY  Tot: 0

Device/Path[26]:Hooper switch   [0x1097002 ] State:RDY  Tot: 0

Device/Path[27]:Hooper switch   [0x1097003 ] State:RDY  Tot: 0
The Port did not go down in this case:
RP/0/RP0/CPU0:ASR-9922-A#sh ipv4 int brief location 0/7/CPU0

Wed Jul  7 14:21:29.693 UTC


Interface                      IP-Address      Status          Protocol Vrf-Name

TenGigE0/7/0/0                 unassigned      Down            Down     default

TenGigE0/7/0/1                 unassigned      Down            Down     default

TenGigE0/7/0/2                 unassigned      Down            Down     default

TenGigE0/7/0/3                 unassigned      Down            Down     default

TenGigE0/7/0/4                 unassigned      Down            Down     default

TenGigE0/7/0/5                 unassigned      Down            Down     default

TenGigE0/7/0/6                 unassigned      Down            Down     default

TenGigE0/7/0/7                 unassigned      Shutdown        Down     default

TenGigE0/7/0/8                 unassigned      Shutdown        Down     default

TenGigE0/7/0/9                 unassigned      Shutdown        Down     default

TenGigE0/7/0/10                unassigned      Down            Down     default

TenGigE0/7/0/11                unassigned      Down            Down     default

TenGigE0/7/0/12                unassigned      Down            Down     default

TenGigE0/7/0/13                unassigned      Shutdown        Down     default

TenGigE0/7/0/14                unassigned      Shutdown        Down     default

TenGigE0/7/0/15                unassigned      Shutdown        Down     default

TenGigE0/7/0/16                unassigned      Shutdown        Down     default

TenGigE0/7/0/17                unassigned      Shutdown        Down     default

TenGigE0/7/0/18                unassigned      Down            Down     default

TenGigE0/7/0/19                unassigned      Up              Up       default  >>>>>>> Port is UP


RP/0/RP0/CPU0:ASR-9922-A#sh logging last 200 | in 0/7/0

Wed Jul  7 14:22:35.715 UTC

RP/0/RP0/CPU0:ASR-9922-A#
Test case 1.2:
NP/Ports behaviour with the fault-manager datapath port toggle command:
RP/0/RP0/CPU0:ASR-9922-A#sh run formal | in data

Wed Jul  7 14:52:11.714 UTC

Building configuration...

fault-manager datapath port toggle

RP/0/RP0/CPU0:ASR-9922-A#
No alarm in PFM:
RP/0/RP0/CPU0:ASR-9922-A#sh pfm location  0/Rp0/CPU0

Wed Jul  7 14:55:13.410 UTC


node: node0_RP0_CPU0

---------------------

CURRENT TIME: Jul  7 14:55:13 2021

PFM TOTAL: 1   EMERGENCY/ALERT(E/A): 1   CRITICAL(CR): 0   ERROR(ER): 0

-------------------------------------------------------------------------------------------------

Raised Time         |S#|Fault Name                         |Sev|Proc_ID|Dev/Path Name |Handle

--------------------+--+-----------------------------------+---+-------+--------------+----------

Jul  1 10:13:45 2021|0 |SPINE_UNAVAILABLE                  |E/A|5082   |Fabric Manager|0x1034000


RP/0/RP0/CPU0:ASR-9922-A#
PUNT error generation in NP0 LC7:
RP/0/RP0/CPU0:ASR-9922-A#monitor np counter PUNT_DIAGS_RSP_ACT np0 count 20 location 0/7/CPU0

Wed Jul  7 14:51:18.596 UTC


Usage of NP monitor is recommended for cisco internal use only.

Please use instead 'show controllers np capture' for troubleshooting packet drops in NP

and 'monitor np interface' for per (sub)interface counter monitoring


Warning: Every packet captured will be dropped! If you use the 'count'

         option to capture multiple protocol packets, this could disrupt

         protocol sessions (eg, OSPF session flap). So if capturing protocol

         packets, capture only 1 at a time.


Warning: A mandatory NP reset will be done after monitor to clean up.

         This will cause ~150ms traffic outage. Links will stay Up.

 Proceed y/n [y] > y

 Monitor PUNT_DIAGS_RSP_ACT on NP0 ... (Ctrl-C to quit)


Wed Jul  7 14:53:21 2021 -- NP0 packet


 From Fabric: 127 byte packet

0000: 00 09 00 00 d8 22 00 00 ff ff ff ff 00 00 ff ff   ....X"..........

0010: 00 ff 00 ff f0 f0 f0 f0 cc cc cc cc aa aa aa aa   ....ppppLLLL****

0020: 55 55 55 55 00 00 00 00 01 00 00 00 00 00 00 00   UUUU............

0030: 00 00 00 00 ff ff ff ff 00 00 ff ff 00 ff 00 ff   ................

0040: f0 f0 f0 f0 cc cc cc cc aa aa aa aa 55 55 55 55   ppppLLLL****UUUU

0050: 00 00 00 00 01 00 00 00 00 00 00 00 00 00 00 00   ................

0060: ff ff ff ff 00 00 ff ff 00 ff 00 ff f0 f0 f0 f0   ............pppp

0070: cc cc cc cc aa aa aa aa 55 55 55 55 00 00 00      LLLL****UUUU...


                                    (count 1 of 20)

Wed Jul  7 14:54:22 2021 -- NP0 packet


 From Fabric: 256 byte packet

0000: 00 09 00 00 d9 22 00 00 ff ff ff ff 00 00 ff ff   ....Y"..........

0010: 00 ff 00 ff f0 f0 f0 f0 cc cc cc cc aa aa aa aa   ....ppppLLLL****

0020: 55 55 55 55 00 00 00 00 01 00 00 00 00 00 00 00   UUUU............

0030: 00 00 00 00 ff ff ff ff 00 00 ff ff 00 ff 00 ff   ................

0040: f0 f0 f0 f0 cc cc cc cc aa aa aa aa 55 55 55 55   ppppLLLL****UUUU

0050: 00 00 00 00 01 00 00 00 00 00 00 00 00 00 00 00   ................

0060: ff ff ff ff 00 00 ff ff 00 ff 00 ff f0 f0 f0 f0   ............pppp

0070: cc cc cc cc aa aa aa aa 55 55 55 55 00 00 00 00   LLLL****UUUU....

0080: 01 00 00 00 00 00 00 00 00 00 00 00 ff ff ff ff   ................

0090: 00 00 ff ff 00 ff 00 ff f0 f0 f0 f0 cc cc cc cc   ........ppppLLLL

00a0: aa aa aa aa 55 55 55 55 00 00 00 00 01 00 00 00   ****UUUU........

00b0: 00 00 00 00 00 00 00 00 ff ff ff ff 00 00 ff ff   ................

00c0: 00 00 00 00 00 00 00 00 00 00 00 00 00 00 00 00   ................

00d0: 00 00 00 00 00 00 00 00 00 00 00 00 00 00 00 00   ................

00e0: 00 00 00 00 00 00 00 00 00 00 00 00 00 00 00 00   ................

00f0: 00 00 00 00 00 00 00 00 00 00 00 00 00 00 00 00   ................


                                    (count 2 of 20)


RP/0/RP0/CPU0:ASR-9922-A#sh pfm location  0/Rp0/CPU0

Wed Jul  7 14:56:24.459 UTC


node: node0_RP0_CPU0

---------------------

CURRENT TIME: Jul  7 14:56:24 2021

PFM TOTAL: 2   EMERGENCY/ALERT(E/A): 1   CRITICAL(CR): 0   ERROR(ER): 1

-------------------------------------------------------------------------------------------------

Raised Time         |S#|Fault Name                         |Sev|Proc_ID|Dev/Path Name |Handle

--------------------+--+-----------------------------------+---+-------+--------------+----------

Jul  1 10:13:45 2021|0 |SPINE_UNAVAILABLE                  |E/A|5082   |Fabric Manager|0x1034000

Jul  7 14:55:23 2021|0 |PUNT_FABRIC_DATA_PATH_FAILED       |ER |9429   |System Punt/Fa|0x2000004

RP/0/RP0/CPU0:ASR-9922-A#sh pfm process 9429 location 0/RP0/CPU0

Wed Jul  7 14:56:39.961 UTC


node: node0_RP0_CPU0

---------------------

CURRENT TIME: Jul  7 14:56:40 2021

PFM TOTAL: 2   EMERGENCY/ALERT(E/A): 1   CRITICAL(CR): 0   ERROR(ER): 1

PER PROCESS TOTAL: 0   EM: 0   CR: 0   ER: 0

Device/Path[1 ]:Fabric loopbac  [0x2000003 ] State:RDY  Tot: 0

Device/Path[2 ]:System Punt/Fa  [0x2000004 ] State:RDY  Tot: 1

1   Fault Id:          432

    Sev:               ER

    Fault Name:        PUNT_FABRIC_DATA_PATH_FAILED

    Raised Timestamp:  Jul  7 14:55:23 2021

    Clear Timestamp:   N/A

    Changed Timestamp: N/A

    Resync Mismatch:   FALSE

    MSG:               failure threshold is 3, (slot, NP) failed: (0/7/CPU0, 0)

Device/Path[3 ]:Crossbar Switc  [0x108c000 ] State:RDY  Tot: 0

Device/Path[4 ]:Crossbar Switc  [0x108c001 ] State:RDY  Tot: 0

Device/Path[5 ]:Crossbar Switc  [0x108c002 ] State:RDY  Tot: 0

Device/Path[6 ]:Crossbar Switc  [0x108c003 ] State:RDY  Tot: 0

Device/Path[7 ]:Crossbar Switc  [0x108c004 ] State:RDY  Tot: 0

Device/Path[8 ]:Crossbar Switc  [0x108c005 ] State:RDY  Tot: 0

Device/Path[9 ]:Crossbar Switc  [0x108c006 ] State:RDY  Tot: 0

Device/Path[10]:Crossbar Switc  [0x108c007 ] State:RDY  Tot: 0

Device/Path[11]:Crossbar Switc  [0x108c008 ] State:RDY  Tot: 0

Device/Path[12]:Crossbar Switc  [0x108c009 ] State:RDY  Tot: 0

Device/Path[13]:Crossbar Switc  [0x108c00a ] State:RDY  Tot: 0

Device/Path[14]:Crossbar Switc  [0x108c00b ] State:RDY  Tot: 0

Device/Path[15]:Crossbar Switc  [0x108c00c ] State:RDY  Tot: 0

Device/Path[16]:Crossbar Switc  [0x108c00d ] State:RDY  Tot: 0

Device/Path[17]:Crossbar Switc  [0x108c00e ] State:RDY  Tot: 0

Device/Path[18]:Fabric Interfa  [0x108b000 ] State:RDY  Tot: 0

Device/Path[19]:Fabric Arbiter  [0x1086000 ] State:RDY  Tot: 0

Device/Path[20]:CPU Controller  [0x108d000 ] State:RDY  Tot: 0

Device/Path[21]:Device Control  [0x109a000 ] State:RDY  Tot: 0

Device/Path[22]:ClkCtrl Contro  [0x109b000 ] State:RDY  Tot: 0

Device/Path[23]:NVRAM           [0x10ba000 ] State:RDY  Tot: 0

Device/Path[24]:Hooper switch   [0x1097000 ] State:RDY  Tot: 0

Device/Path[25]:Hooper switch   [0x1097001 ] State:RDY  Tot: 0

Device/Path[26]:Hooper switch   [0x1097002 ] State:RDY  Tot: 0

Device/Path[27]:Hooper switch   [0x1097003 ] State:RDY  Tot: 0
Interface TenGigE0/7/0/19 went down of NP0:
RP/0/RP0/CPU0:ASR-9922-A#show logging last 200 | in 0/7/0

Wed Jul  7 14:58:42.959 UTC

LC/0/7/CPU0:Jul  7 14:55:23.798 UTC: ifmgr[270]: %PKT_INFRA-LINK-3-UPDOWN :
 Interface TenGigE0/7/0/19, changed state to Down

LC/0/7/CPU0:Jul  7 14:55:23.798 UTC: ifmgr[270]: %PKT_INFRA-LINEPROTO-5-UPDOWN :
 Line protocol on Interface TenGigE0/7/0/19, changed state to Down

RP/0/RP0/CPU0:Jul  7 14:55:23.802 UTC: BM-DISTRIB[1290]: %L2-BM-6-ACTIVE :
 TenGigE0/7/0/19 is no longer Active as part of Bundle-Ether854 (Link is down)

LC/0/7/CPU0:Jul  7 14:55:25.854 UTC: vic_0_0[379]: %PLATFORM-VIC-4-RFI :
 Interface TenGigE0/7/0/19, Detected Remote Fault

LC/0/7/CPU0:Jul  7 14:55:26.936 UTC: lda_server[114]: %PKT_INFRA-FM-2-FAULT_CRITICAL :
 ALARM_CRITICAL :OPTICS RX POWER LANE-0 LOW ALARM :CLEAR : Te0/7/0/0:
Stopped PUNT error generation:
RP/0/RP0/CPU0:ASR-9922-A#sh ipv4 int brief location 0/7/CPU0

Wed Jul  7 14:59:16.322 UTC


Interface                      IP-Address      Status          Protocol Vrf-Name

TenGigE0/7/0/0                 unassigned      Down            Down     default

TenGigE0/7/0/1                 unassigned      Down            Down     default

TenGigE0/7/0/2                 unassigned      Down            Down     default

TenGigE0/7/0/3                 unassigned      Down            Down     default

TenGigE0/7/0/4                 unassigned      Down            Down     default

TenGigE0/7/0/5                 unassigned      Down            Down     default

TenGigE0/7/0/6                 unassigned      Down            Down     default

TenGigE0/7/0/7                 unassigned      Shutdown        Down     default

TenGigE0/7/0/8                 unassigned      Shutdown        Down     default

TenGigE0/7/0/9                 unassigned      Shutdown        Down     default

TenGigE0/7/0/10                unassigned      Down            Down     default

TenGigE0/7/0/11                unassigned      Down            Down     default

TenGigE0/7/0/12                unassigned      Down            Down     default

TenGigE0/7/0/13                unassigned      Shutdown        Down     default

TenGigE0/7/0/14                unassigned      Shutdown        Down     default

TenGigE0/7/0/15                unassigned      Shutdown        Down     default

TenGigE0/7/0/16                unassigned      Shutdown        Down     default

TenGigE0/7/0/17                unassigned      Shutdown        Down     default

TenGigE0/7/0/18                unassigned      Down            Down     default

TenGigE0/7/0/19                unassigned      Down            Down     default  >>>>>>
Alarm stopped:
RP/0/RP0/CPU0:ASR-9922-A#sh pfm location  0/Rp0/CPU0

Wed Jul  7 15:01:44.478 UTC


node: node0_RP0_CPU0

---------------------

CURRENT TIME: Jul  7 15:01:44 2021

PFM TOTAL: 1   EMERGENCY/ALERT(E/A): 1   CRITICAL(CR): 0   ERROR(ER): 0

-------------------------------------------------------------------------------------------------

Raised Time         |S#|Fault Name                         |Sev|Proc_ID|Dev/Path Name |Handle

--------------------+--+-----------------------------------+---+-------+--------------+----------

Jul  1 10:13:45 2021|0 |SPINE_UNAVAILABLE                  |E/A|5082   |Fabric Manager|0x1034000

RP/0/RP0/CPU0:ASR-9922-A#
Interface came UP:
RP/0/RP0/CPU0:ASR-9922-A#show logging  | in 0/7/0/19

Wed Jul  7 15:06:11.532 UTC

LC/0/7/CPU0:Jul  7 14:55:23.798 UTC: ifmgr[270]: %PKT_INFRA-LINK-3-UPDOWN :
 Interface TenGigE0/7/0/19, changed state to Down

LC/0/7/CPU0:Jul  7 14:55:23.798 UTC: ifmgr[270]: %PKT_INFRA-LINEPROTO-5-UPDOWN :
 Line protocol on Interface TenGigE0/7/0/19, changed state to Down

RP/0/RP0/CPU0:Jul  7 14:55:23.802 UTC: BM-DISTRIB[1290]: %L2-BM-6-ACTIVE :
 TenGigE0/7/0/19 is no longer Active as part of Bundle-Ether854 (Link is down)

LC/0/7/CPU0:Jul  7 14:55:25.854 UTC: vic_0_0[379]: %PLATFORM-VIC-4-RFI :
 Interface TenGigE0/7/0/19, Detected Remote Fault

LC/0/7/CPU0:Jul  7 15:03:27.204 UTC: ifmgr[270]: %PKT_INFRA-LINK-3-UPDOWN :
 Interface TenGigE0/7/0/19, changed state to Up

LC/0/7/CPU0:Jul  7 15:03:27.206 UTC: ifmgr[270]: %PKT_INFRA-LINEPROTO-5-UPDOWN :
 Line protocol on Interface TenGigE0/7/0/19, changed state to Up

RP/0/RP0/CPU0:Jul  7 15:03:29.219 UTC: BM-DISTRIB[1290]: %L2-BM-6-ACTIVE :
 TenGigE0/7/0/19 is Active as part of Bundle-Ether854
Revision History
| Revision | Publish Date | Comments |
|---|---|---|
1.0 |
09-Jan-2023 |
Initial Release |
Contributed by Cisco Engineers
- Ritesh ShettyCisco Technical Leader
Contact Cisco
- Open a Support Case

- (Requires a Cisco Service Contract)
 Feedback