Introduction
This document describes the steps to identify and troubleshoot an IP SLA tracked device on remote POD using ACI PBR Multipod environment.
Prerequisites
Requirements
Cisco recommends that you have knowledge of these topics:
- Multipod Solution
- Service Graphs with PBR
Components Used
The information in this document is based on these software and hardware versions:
- Cisco ACI version 4.2(7l)
- Cisco Leaf switch N9K-C93180YC-EX
- Cisco Spine switch N9K-C9336PQ
- Nexus 7k version 8.2(2)
The information in this document was created from the devices in a specific lab environment. All of the devices used in this document started with a cleared (default) configuration. If your network is live, ensure that you understand the potential impact of any command.
Network Topology
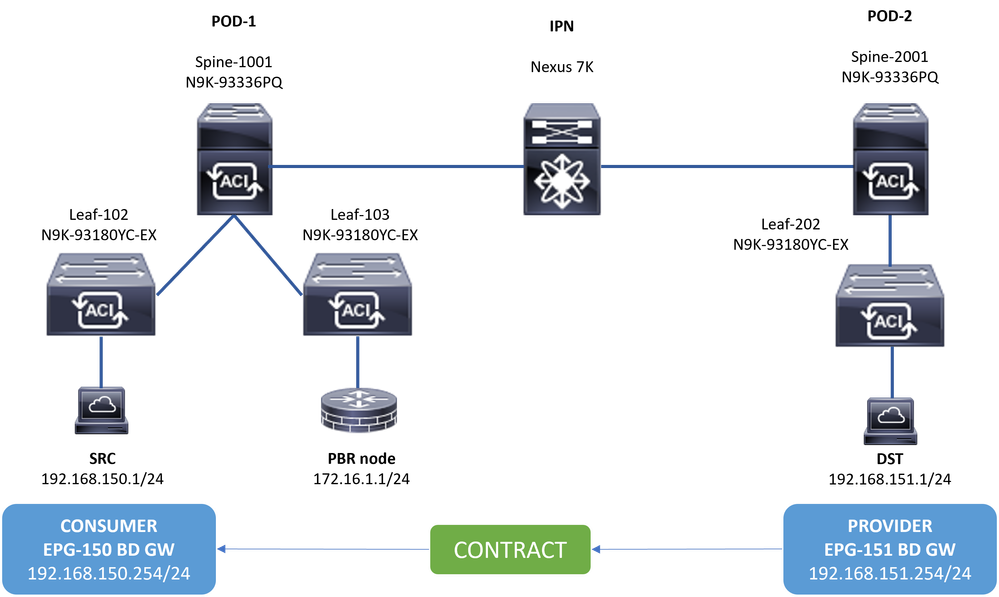
 Topology
Background Information
Using a service graph, Cisco ACI can redirect traffic between security zones to a firewall or a load balancer, without the need for the firewall or the load balancer to be the default gateway for the servers.
IP SLA feature on PBR setup allows the ACI fabric to monitor that service node (L4-L7 device) in your environment and enables the fabric to not redirect traffic between source and destination to a service node that is down if it is unreachable.

Note: ACI IPSLA depends on fabric system GIPO (multicast address 239.255.255.240/28) to send the probes and distribute tracking status.
Scenario
In this example, east-west connectivity cannot be completed between source endpoint 192.168.150.1 on POD-1 to destination server 192.168.151.1 on POD-2. Traffic is being redirected to PBR node 172.16.1.1 from service leaf 103 on POD-1. PBR is using IP SLA monitoring and Redirect Health Group policies.
Troubleshooting Steps
Step 1. Identify IP SLA status
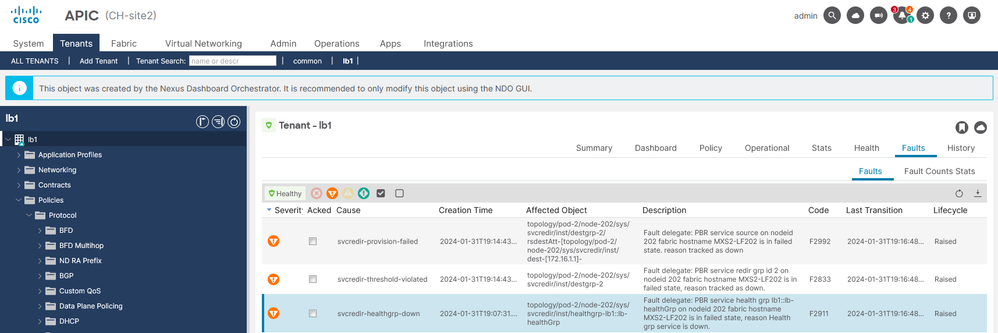
- On APIC UI navigate to Tenants > Your_Tenant > Faults.
- Look for faults F2911, F2833, F2992.
 IP SLA Faults
Step 2. Identify Node ID with Health Group in Down state
- On APIC CLI, run moquery command using either fault F2911, F2833, F2992.
- You can see that health group lb1::lb-healthGrp is down for Leaf 202 in POD-2.
MXS2-AP002# moquery -c faultInst -f 'fault.Inst.code == "F2911"'
# fault.Inst
code : F2911
ack : no
alert : no
annotation :
cause : svcredir-healthgrp-down
changeSet : operSt (New: disabled), operStQual (New: healthgrp-service-down)
childAction :
created : 2024-01-31T19:07:31.505-06:00
delegated : yes
descr : PBR service health grp lb1::lb-healthGrp on nodeid 202 fabric hostname MXS2-LF202 is in failed state, reason Health grp service is down.
dn : topology/pod-2/node-202/sys/svcredir/inst/healthgrp-lb1::lb-healthGrp/fault-F2911   <<<
domain : infra
extMngdBy : undefined
highestSeverity : major
Step 3. Validate PBR device is learned as an endpoint and reachable from Service Leaf
MXS2-LF103# show system internal epm endpoint ip 172.16.1.1

MAC : 40ce.2490.5743 ::: Num IPs : 1
IP# 0 : 172.16.1.1 ::: IP# 0 flags : ::: l3-sw-hit: No
Vlan id : 22 ::: Vlan vnid : 13192 ::: VRF name : lb1:vrf1
BD vnid : 15958043 ::: VRF vnid : 2162693
Phy If : 0x1a00b000 ::: Tunnel If : 0
Interface : Ethernet1/12
Flags : 0x80004c04 ::: sclass : 16391 ::: Ref count : 5
EP Create Timestamp : 02/01/2024 00:36:23.229262
EP Update Timestamp : 02/02/2024 01:43:38.767306
EP Flags : local|IP|MAC|sclass|timer|

MXS2-LF103# iping 172.16.1.1 -V lb1:vrf1
PING 172.16.1.1 (172.16.1.1) from 172.16.1.254: 56 data bytes
64 bytes from 172.16.1.1: icmp_seq=0 ttl=255 time=1.046 ms
64 bytes from 172.16.1.1: icmp_seq=1 ttl=255 time=1.074 ms
64 bytes from 172.16.1.1: icmp_seq=2 ttl=255 time=1.024 ms
64 bytes from 172.16.1.1: icmp_seq=3 ttl=255 time=0.842 ms
64 bytes from 172.16.1.1: icmp_seq=4 ttl=255 time=1.189 ms

--- 172.16.1.1 ping statistics ---
5 packets transmitted, 5 packets received, 0.00% packet loss
round-trip min/avg/max = 0.842/1.034/1.189 ms
Step 4. Check PBR health group in Local POD and Remote POD

Note: Consider Local POD the one that gets the PBR device configured.
Leaf 103 is the Service Leaf on POD-1. Therefore we consider POD-1 as the local POD and POD-2 as the remote POD.
The health group is only programmed on leaf switches where source and destination EPGs contract demand its deployment.
1. Source EPG is located on Leaf Node 102 POD-1. You can see PBR device is tracked as UP from Service Leaf 103 POD-1.
=======================================================================================================================================
LEGEND
TL: Threshold(Low) | TH: Threshold(High) | HP: HashProfile | HG: HealthGrp | BAC: Backup-Dest | TRA: Tracking | RES: Resiliency
=======================================================================================================================================
HG-Name HG-OperSt HG-Dest HG-Dest-OperSt
======= ========= ======= ==============
lb1::lb-healthGrp enabled dest-[172.16.1.1]-[vxlan-2162693]] up
2. Destination EPG is located on Leaf Node 202 POD-2. You can see PBR device is tracked as DOWN from Service Leaf 103 POD-1.
MXS2-LF202# show service redir info health-group lb1::lb-healthGrp
=======================================================================================================================================
LEGEND
TL: Threshold(Low) | TH: Threshold(High) | HP: HashProfile | HG: HealthGrp | BAC: Backup-Dest | TRA: Tracking | RES: Resiliency
=======================================================================================================================================
HG-Name HG-OperSt HG-Dest HG-Dest-OperSt
======= ========= ======= ==============
lb1::lb-healthGrp disabled dest-[172.16.1.1]-[vxlan-2162693]] down            <<<<<  Health Group is down.
Step 5. Capture IP SLA probes with ELAM tool

Note: You can use Embedded Logic Analyzer Module (ELAM), an inbuilt capture tool, to capture the incoming packet. The ELAM syntax is dependent on the type of hardware. Another approach is to use the ELAM Assistant app.
To capture the IP SLA probes, you must use these values on the ELAM syntax to understand where the packet reaches or is being dropped.
ELAM Inner L2 header
Source MAC = 00-00-00-00-00-01
Destination MAC = 01-00-00-00-00-00

Note: Source MAC and Destination Mac (shown previously) are fixed values on Inner header for IP SLA packets.
ELAM Outer L3 header
Source IP = TEP from your Service Leaf ( Leaf 103 TEP in LAB = 172.30.200.64 )
Destination IP = 239.255.255.240 ( Fabric system GIPO must be always the same )
trigger reset
trigger init in-select 14 out-select 0
set inner l2 dst_mac 01-00-00-00-00-00 src_mac 00-00-00-00-00-01
set outer ipv4 src_ip 172.30.200.64 dst_ip 239.255.255.240
start
stat
ereport

...

------------------------------------------------------------------------------------------------------------------------------------------------------
Inner L2 Header
------------------------------------------------------------------------------------------------------------------------------------------------------
Inner Destination MAC : 0100.0000.0000
Source MAC : 0000.0000.0001
802.1Q tag is valid : no
CoS : 0
Access Encap VLAN : 0

------------------------------------------------------------------------------------------------------------------------------------------------------
Outer L3 Header
------------------------------------------------------------------------------------------------------------------------------------------------------
L3 Type : IPv4
DSCP : 0
Don't Fragment Bit : 0x0
TTL : 27
IP Protocol Number : UDP
Destination IP : 239.255.255.240
Source IP : 172.30.200.64
Step 6. Check Fabric system GIPO ( 239.255.255.240 ) is programmed on Local and Remote spines

Note: For each GIPO, only one spine node from each POD is elected as the authoritative device to forward multicast frames and send IGMP joins toward the IPN.
1. Spine 1001 POD-1 is the authoritative switch to forward multicast frames and send IGMP joins toward the IPN.
Interface Eth1/3 is facing towards the N7K IPN.
MXS2-SP1001# show isis internal mcast routes gipo | more
IS-IS process: isis_infra
VRF : default

GIPo Routes
====================================
System GIPo - Configured: 0.0.0.0
Operational: 239.255.255.240
====================================

<OUTPUT CUT> ...

GIPo: 239.255.255.240 [LOCAL]
OIF List:
Ethernet1/35.36
Ethernet1/3.3(External)     <<< Interface must point out to IPN on elected Spine
Ethernet1/16.40
Ethernet1/17.45
Ethernet1/2.37
Ethernet1/36.42
Ethernet1/1.43


MXS2-SP1001# show ip igmp gipo joins | grep 239.255.255.240
239.255.255.240 0.0.0.0 Join Eth1/3.3 43 Enabled
2. Spine 2001 POD-2 is the authoritative switch to forward multicast frames and send IGMP joins toward the IPN.
Interface Eth1/36 is facing towards the N7K IPN.
MXS2-SP2001# show isis internal mcast routes gipo | more
IS-IS process: isis_infra
VRF : default

GIPo Routes
====================================
System GIPo - Configured: 0.0.0.0
Operational: 239.255.255.240
====================================

<OUTPUT CUT> ...

GIPo: 239.255.255.240 [LOCAL]
OIF List:
Ethernet1/2.40
Ethernet1/1.44
Ethernet1/36.36(External)     <<< Interface must point out to IPN on elected Spine


MXS2-SP2001# show ip igmp gipo joins | grep 239.255.255.240
239.255.255.240 0.0.0.0 Join Eth1/36.36 76 Enabled
3. Make sure the outgoing-interface-list gipo is not empty from VSH for both spines.
MXS2-SP1001# vsh
MXS2-SP1001# show forwarding distribution multicast outgoing-interface-list gipo | more
....
Outgoing Interface List Index: 1
Reference Count: 1
Number of Outgoing Interfaces: 5
Ethernet1/35.36
Ethernet1/3.3
Ethernet1/2.37
Ethernet1/36.42
Ethernet1/1.43
External GIPO OIFList
Ext OIFL: 8001
Ref Count: 393
No OIFs: 1
Ethernet1/3.3
Step 7. Validate GIPO ( 239.255.255.240 ) is configured on the IPN
1. GIPO 239.255.255.240 is missing on IPN configuration.
N7K-ACI_ADMIN-VDC-ACI-IPN-MPOD# show run pim
  ...
  ip pim rp-address 192.168.100.2 group-list 225.0.0.0/15 bidir
  ip pim ssm range 232.0.0.0/8

N7K-ACI_ADMIN-VDC-ACI-IPN-MPOD# show ip mroute 239.255.255.240
IP Multicast Routing Table for VRF "default"

(*, 239.255.255.240/32), uptime: 1d01h, igmp ip pim
Incoming interface: Null, RPF nbr: 0.0.0.0     <<< Incoming interface and RPF are MISSING
Outgoing interface list: (count: 2)
Ethernet3/3.4, uptime: 1d01h, igmp
Ethernet3/1.4, uptime: 1d01h, igmp
2. GIPO 239.255.255.240 is now configured on IPN.
N7K-ACI_ADMIN-VDC-ACI-IPN-MPOD# show run pim
  ...
  ip pim rp-address 192.168.100.2 group-list 225.0.0.0/15 bidir
  ip pim rp-address 192.168.100.2 group-list 239.255.255.240/28 bidir     <<< GIPO is configured
  ip pim ssm range 232.0.0.0/8

N7K-ACI_ADMIN-VDC-ACI-IPN-MPOD# show ip mroute 225.0.42.16
IP Multicast Routing Table for VRF "default"

(*, 225.0.42.16/32), bidir, uptime: 1w6d, ip pim igmp
Incoming interface: loopback1, RPF nbr: 192.168.100.2
Outgoing interface list: (count: 2)
Ethernet3/1.4, uptime: 1d02h, igmp
loopback1, uptime: 1d03h, pim, (RPF)
Step 8. Confirm IP SLA tracking is UP on remote POD
MXS2-LF202# show service redir info health-group lb1::lb-healthGrp
=======================================================================================================================================
LEGEND
TL: Threshold(Low) | TH: Threshold(High) | HP: HashProfile | HG: HealthGrp | BAC: Backup-Dest | TRA: Tracking | RES: Resiliency
=======================================================================================================================================
HG-Name HG-OperSt HG-Dest HG-Dest-OperSt
======= ========= ======= ==============
lb1::lb-healthGrp enabled dest-[172.16.1.1]-[vxlan-2162693]] up
Related Information
| Cisco bug ID |
Bug title |
Fix version |
| Cisco bug ID CSCwi75331 |
|
No fixed version. Use workaround. |


 Feedback