Verify the Health of a Tetration Analytics Cluster
Available Languages
Bias-Free Language
The documentation set for this product strives to use bias-free language. For the purposes of this documentation set, bias-free is defined as language that does not imply discrimination based on age, disability, gender, racial identity, ethnic identity, sexual orientation, socioeconomic status, and intersectionality. Exceptions may be present in the documentation due to language that is hardcoded in the user interfaces of the product software, language used based on RFP documentation, or language that is used by a referenced third-party product. Learn more about how Cisco is using Inclusive Language.
Contents
Introduction
This document describes how to verify the health of a Tetration Analytics cluster.
Prerequisites
Requirements
Cisco recommends that you have knowledge of these topics:
- Logging into a cluster
- Basic User Interface (UI) experience
Components Used
The information in this document is based on these software and hardware versions:
- Version 2.2.1.x
- 39RU Tetration Analytics Cluster
The information in this document was created from the devices in a specific lab environment. All of the devices used in this document started with a cleared (default) configuration. If your network is live, make sure that you understand the potential impact of any command.
Background Information
A Tetration cluster consists of hundreds of processes (programs) running across multiple VMs [Vitual Machines] on multiple UCS C220-M4 servers. Several services and features are in place to help monitor the operations of the cluster and alert the administrator when the cluster may not be fully functional.
This document provides a view of what to check when verifying the health of the cluster. While the scope of this document includes verifying the health, if action is required to help address what appears to be something not functioning properly, collect a snapshot and open up a case with the Cisco Tetration Solution Support TAC team.
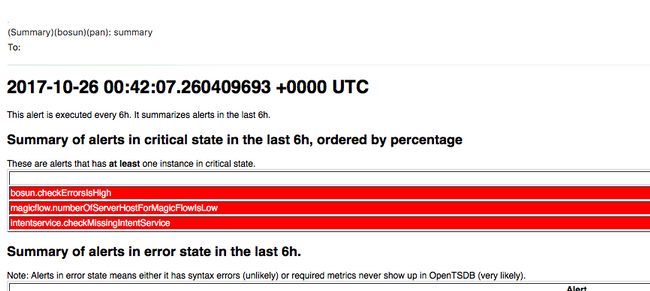
Two common tools used to verify the health of the cluster are the Cluster Status and Service Status pages which are covered in this document along with a couple of other system tools. Though Bosun critical email alerts are often one of the first indications to an administrator that something may be occurring in the cluster, verifying the health of the cluster is typically best done through the Cluster Status and Service Status pages.
While Boson alerts provide syslog like capabilities, in some Tetration releases, some critical Bosun alerts have been triggered in a normally functioning cluster. A search through cisco.com bug search tool for Tetration product with the metric keyword will help to identify possible issues for a specific metric.
When to Check the Health of the Cluster:
Normally, the administrator of the cluster will not have to check the functionality of the cluster. There are however certain times when it may be needed. A few examples are listed here:
- When the user sees unexpected behavior in the user interface (UI). This in part is based upon the user's knowledge and experience of how the cluster should be functioning but some examples are shown in this section Operational Display Parameters.
- When some data is expected to be seen but it not displayed in the UI. For example, flow data from a software or hardware agent (sensor) when viewing the proper scope and time range where data is expected to be displayed.
- Before and after any scheduled service, upgrade, or major action of the cluster. It is best practice to collect a snapshot before and another snapshot after any maintenance and have this available in case a TAC case is opened. This helps TAC isolate the issue by looking for changes made during the maintenance.
Note: Some service disruptions are normal for a period of time immediately following system maintenance on the cluster. The period of time may be up to 24 hours in the example of a server replacement where a datanode VM runs on that server. Normal system redundancy in the cluster typically mitigates negative effects of a single server replacement.
Different Ways to Verify the Operational State of a Tetration Cluster
Operational Display Parameters
An administrator that has knowledge and experience of the operation of the cluster is able to recognize what the normal operation of the cluster looks like in their environment. These are a few examples of what to look for when verify whether the cluster is operating normally.
Example 1: The latest flow time available is within 10 minutes of the current time

Example 2: The latest Application Workspace time available is within 10 hours of the current time:

Example 3: Dashboard content is populated.

Cluster Status
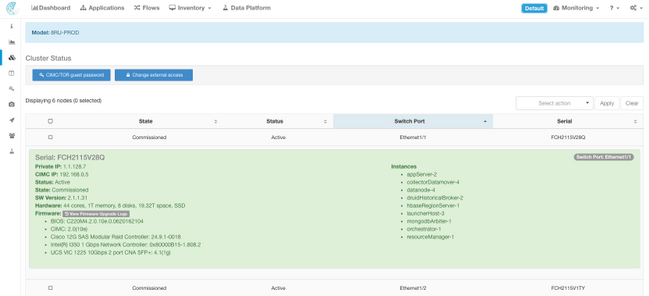
A Tetration Analytics cluster consists of either 6 (8RU) or 36 (39RU) servers depending on the cluster type. The Cluster Status page provides the state of the servers as well as other bare metal server information.
The Cluster Status page is located in the Maintenance menu available from the settings drop-down (Settings > Maintenace; Cluster Status in left column.)
Note: Only the icon is visible until you click on left hand column.
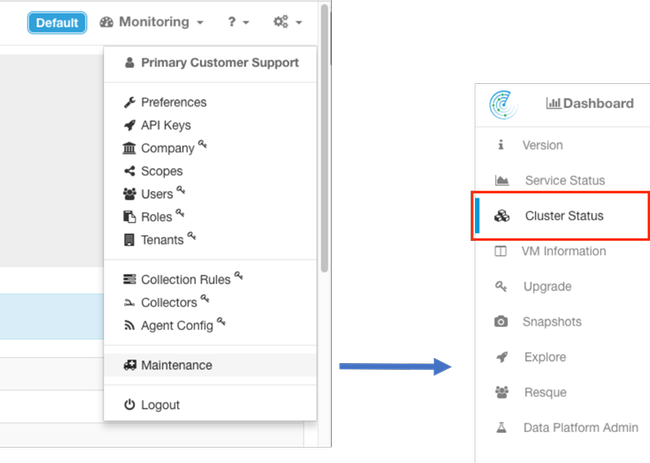
Note: Image is truncated to the first 6 of 36 servers (39RU cluster).

- Instances (virtual machines) running on the bare metal server.
- Private IP Address within the cluster.
- CIMC IP Address within the cluster.
- Firmware Versions (BIOS, CIMC, RAID Controller) running on the server.
Service Status
The ServiceStatus page displays all services that are used in Cisco Tetration Analytics cluster with their dependencies and health status.
The Service Status page is located in the Maintenance menu available from the settings drop-down. (Settings > Maintenace; Service Status in left column.)
Note: Only the icon is visible until you click on left hand column.

By default the Service Status page shows the cluster functions and dependencies in a graphical view. If the icons are all green, no error is detected.

If there is a service that displays in red or orange, the tree view will show the list of services and allow you to drill-down on the dependencies of the service as well as on other details the Service Status function has detected. This dependency error information is particularly important to note and capture when opening a case with the TAC.
For example, here is what the list display looks like when one of the HDFS DataNode virtual machines in the cluster is down
Note: There may not be a noticeable impact to the cluster due to redundancy designed into the Tetration cluster.

Note: There may be some delay in certain services returning to a functioning state after maintenance has been performed. For example, a server that has a DataNode virtual machine instance running on it that is decommissioned and recommissioned for RMA maintenance may take up to 24 hours before the detected issue clears.
Though details in Service Status indicate what may be happening in the event of some detected issue, the recommendation is to open a TAC case if there are any questions about the meaning and/or potential actions to take to remediate them.
Bosun Alerts


Collect Snapshot and Open TAC Case
The Cisco Tetration Solution Team specializes and supports Tetration Analytics customers. One of the common items that help TAC engineer the most with their troubleshooting process is a snapshot collection of logs from the cluster. Sometimes only the information contained in the snapshot log files is enough to understand the issue. If not, a snapshot provides the starting point in the troubleshooting process in many cases.
A snapshot in a Tetration cluster is similar to techsupport in other Cisco products. It is a compressed tarball file or log files from all servers and virtual machines and includes:
- Logs
- State of Hadoop/YARN application and logs
- Alert history
- Numerous TSDB statistics
The snapshot page is located in the Maintence menu available from the settings pulldown. (Settings > Maintenace; Snapshots in left column.)
Note: Only the icon is visible until you click on left hand column.
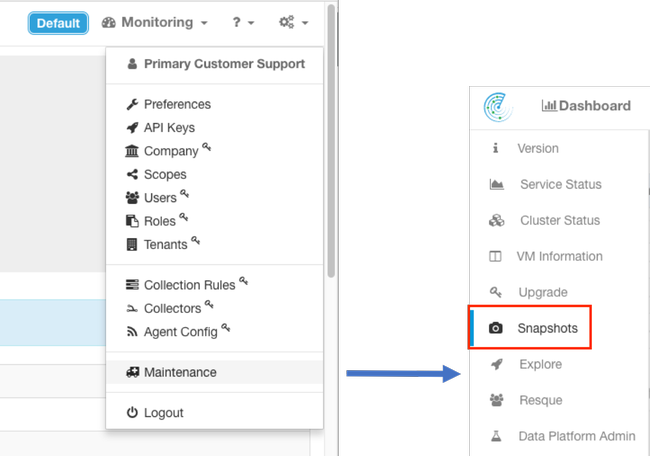
The snapshot page offers various options to select but unless instructed by a TAC engineer, the default values can be used to collect the snapshot.
One important area to modify is Comments. Comments should provide information to indicate why the snapshot was collected when there are multiple snapshots collected from the cluster and the comment added are also available inside the snapshot during analysis by Cisco TAC.
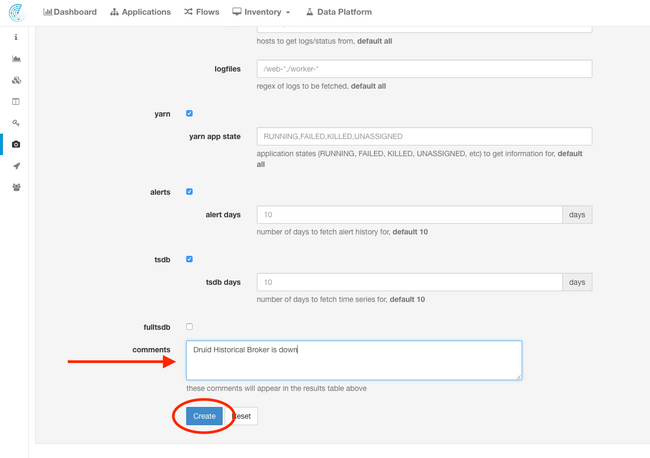
When the Create button is clicked, the snapshot process begins. Only one snapshot can be created at a time and it takes several minutes for the process to complete. A progress bar for the snapshot collection is seen at the top of the snapshot page.
The snapshot can then be downloaded to the user's local system as you clicked the appropriate Download link on the snapshot page, as shown in the image:

Note: The snapshot file may be as large as several hundred megabytes in size. This file can then be uploaded into the open TAC case.
Related Information
Contributed by Cisco Engineers
- Bryan DeaverCisco TAC Enginer
Contact Cisco
- Open a Support Case

- (Requires a Cisco Service Contract)
 Feedback