Introduction
This document describes how to collect Heap dump and Thread dump for Tomcat from Cisco Customer Voice Portal (CVP) Voice eXtensible Markup Language Server (VXML).
Prerequisites
Requirements
Cisco recommends that you have knowledge of these topics:
- CVP
- CVP VXML Server
- CVP VXML Applications
Components Used
The information in this document is based on these software and hardware versions:
- CVP Version 11.5
- CVP VXML Server 11.5
The information in this document was created from the devices in a specific lab environment. All the devices used in this document started with a cleared (default) configuration. If your network is live, ensure that you understand the potential impact of any command.
Problem
Scenario 1. While you monitor VXML Server performance you discovered that it uses 4GB of memory. You would like to know the root cause of the memory leak before it crashes.
Scenario 2. While you monitor VXML Server, you discovered that VXML server uses high threads ( ~ 500), which is quite unusual. You would like to know how to analyze the thread usage and find out the thread state and component/application which takes more threads.
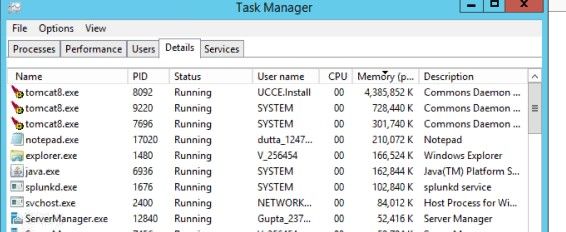
For instance: VXML Tomcat consumes 4.5GB of total memory, as shown in the image.
 VXML Memory at 4.5 GB
Troubleshoot
Steps to get heap dump
Step 1. Download JDK version similar to the Version installed in CVP
C:\Cisco\CVP\jre\bin>java -version
java version "1.7.0_51"
Java(TM) SE Runtime Environment (build 1.7.0_51-b13)
Java HotSpot(TM) Client VM (build 24.51-b03, mixed mode)
Step 2. Copy JDK from the desktop to the CVP Server.
Download windows JDK exe
Open with 7-Zip
Dump contents into a directory %JDK-EXE%
cmd: cd %JDK-EXE%.rsrc\1033\JAVA_CAB10
cmd: extrac32 111
Now have a tools.zip in directory, open it in 7-Zip
Extract contents into a new directory %JDK-VERSION%
cmd: cd %JDK-VERSION%
cmd: for /r %x in (*.pack) do .\bin\unpack200 -r "%x" "%~dx%~px%~nx.jar"
Note: Simply download JDK from http://www.oracle.com/technetwork/java/javaee/downloads/index.html and install EXE on local folder and copy the JDK from your local machine to CVP .
Step 3. Collect the Process ID ( PID) of the VXML Server from the Task Manager.

Step 4. Execute this command in order to collect HeapDump. ( Ex: jmap -dump:file=vxml.hprof <PID OF TOMCAT Instance).
C:\jdk1.7.0_80\jdk1.7.0_80\bin>jmap -dump:file=vxml.hprof 1308
Dumping heap to C:\jdk1.7.0_80\jdk1.7.0_80\bin\vxml.hprof ...
Heap dump file created

C:\jdk1.7.0_80\jdk1.7.0_80\bin>

Note:Your hProf is created and you can copy to the local system and monitor offline.
Steps to get thread dump
Thread dump collection is relatively easy compared to heap dump.
Step 1. Connect to CVP VXML Server on <CVP VXML Server>:9696 ( 9696 is default JMX Port for VXML Server) that uses jVisualVM.
Step 2. Righ-clik on JXM Connection and Collect Thread Dump.

Step 3. Here thread dump dumped in the remote server, where it can be saved as a file and used for further analysis.
