Introduction
This document describes how to troubleshoot Webex Contact Center (WxCC) related issues and how to gather relevant information for TAC.
Prerequisites
Requirements
Cisco recommends that you have knowledge of these topics:
- WxCC
- Contact Center and Voice Over Internet Protocol (VoIP)
- HTTP/Websocket connections
Note: This document is targeted towards customers and partners who uses Webex Contact Center.
Components Used
This document is not restricted to specific software and hardware versions.
- WxCC Agent desktop application
- WxCC Portal
- WxCC Reporting Analytics
The information in this document was created from the devices in a specific lab environment. All of the devices used in this document started with a cleared (default) configuration. If your network is live, ensure that you understand the potential impact of any command.
Webex Contact Center Agent Desktop
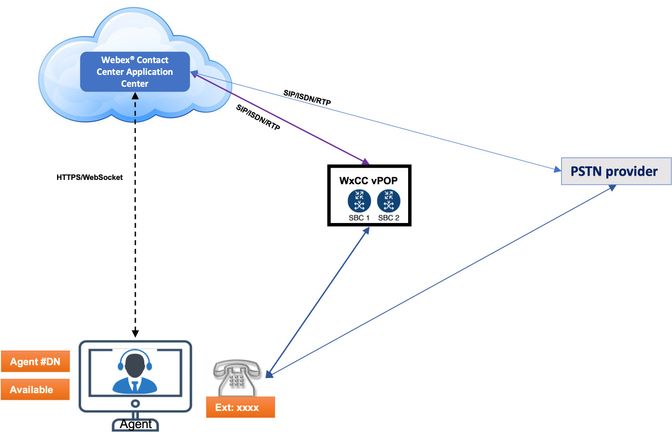
Image 1.0: High Level connection image
Agent Desktop Requirements
The Agent Desktop requires the mentioned setup to ensure that all features work as expected before you attempt to sign in for the first time.
System Requirements
The minimum system requirements are:
-
Memory — 2 GB overall application RAM, without the operating system allocation.
-
Operating System — The supported operating systems (OS) are:
-
Windows 10 and later
-
macOS 10.12, 10.13, 10.14 and later
-
Chrome OS 70 (64-bit) and later
Browser Requirements
The table lists the supported browsers.
|
Operating System
|
Browser Version
|
|
Windows 10
|
-
Google Chrome V76.0.3809 and later
-
Firefox Extended Support Release (ESR) V68 and later
-
Edge Chromium (MS Edge V79 and later)
|
|
macOS
|
-
Google Chrome V76.0.3809 and later
-
Firefox Extended Support Release (ESR) V68 and later
-
Edge Chromium (MS Edge V79 and later)
|
|
Chrome OS
|
|
For more information please refer: Cisco Webex Contact Center Agent Desktop User Guide
Collect Generic Information for all Webex Contact Center Issues
- Problem Description - Gather complete information about the exact issue. Include information such as how many users are affected, the exact timestamp, is it a new deployment? and so on.
- Environment - On virtual desktop? Work from home? Connected via VPN?
- Configuration Changes - Any recent changes on WxCC or network?
- Business Impact - Define the exact business impact. Associate it to a number if possible. For example, this issue impacts 20 agents, 9 out of 10 calls to the call center fails, and so on.
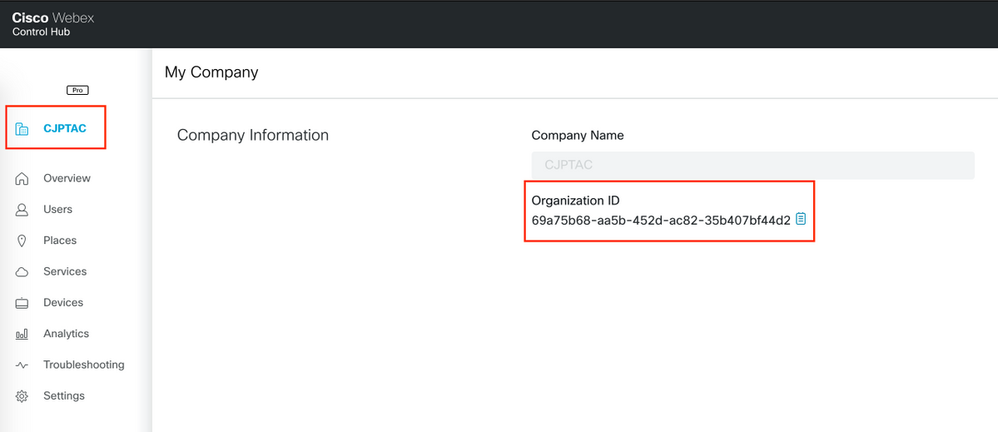
- Customer Org ID: - This is found on the bottom of control hub page, as shown in the image.
Customer Org ID:
Common Issues, Troubleshoot Steps, and Data Collection for TAC
| Type of Issue |
Description |
Troubleshoot Steps |
Details to Analyze |
Data to Collect |
Agent Desktop Looses Connectivity
Image 1.1:Connection Failure. Trying to recover
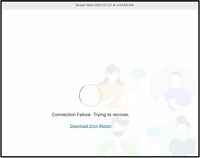
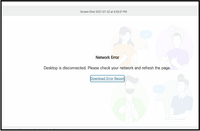
Image 1.2: Network Error
|
- Agent Applet is the web user interface (UI) for the agents to perform day-to-day operations on Voice, Email, Chat so on
- Agent desktop connection stays active based on keepAlives between Agent desktop and WxCC and vise-versa
- Every 4 seconds Agent desktop sends keepAlive to WxCC and receive the ack from WxCC
- In case if keepalives are missed, After 16 secs websocket is disconnected & connection recovery is triggered. [Image 1.1] is shown on Agent desktop. WxCC makes this agent IDLE and is no more considered for call routing by WxCC
- If connection recovery is not successful within the recovery timer (configured on CH, default is 120secs) then WxCC logouts the Agent completely. At this time [Image 1.2] Is displayed on Agent desktop
- Image 1.1: Connection Failure: Agent desktop declares its a Connection failure when 3 heart-beats are missed consecutively
- In Technical terms for connection failure to occur the connection between Agent desktop and WxCC can be down for a total of 16secs
- Image 1.2: Network Error: If agent desktop browser session loses connectivity for more than 120 seconds(configurable in Control hub ORG settings), they are logged out of WxCC and requires agent desktop to refresh or re-log in
|
- Image 1.1 : Connection Failure: If you see this intermittently and agent desktop recovers automatically and connects back - the problem could be very local to machine on which agent desktop is launched or the network path (agent desktop <> WxCC Application center) [Image 1.0]
- Check the immediate network connection stability : Laptop/PC <> Wifi router connection
- Run continuous ping to your router IP address
- eg: < ping 192.168.1.1 -t > Windows
- eg: < ping 192.168.1.1 > MacOS
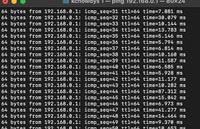
[Image: Good network connection]
[Image: Bad network connection]
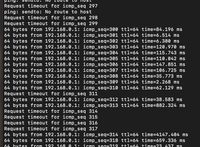
- Monitor the ping and when Image 1.1: immediately check the ping window, if you see drops [Image: Bad network connection] then the network connection between laptop and your wifi router is not stable
- If there were no drops seen [Image: Good network connection] between Laptop/PC <> Wifi router then the problem can be on the path of router <> ISP or ISP <> WxCC
- To further identify and isolate the problem run and monitor the ping to router IP and as well as any internet resource (for example, google DNS)
For example, ping 4 2 2 2 or ping 8.8.8.8
[Image: Wifi network v/s Internet]

- If there are drops in either of the ping windows, or in the path of network then agent desktop is likely to loose connectivity to WxCC
- If image 1.1: occurs followed by image 1.2: that means agent desktop encountered network disconnect for 120 secs and more
|
- How many agents experience this issue?
- Are agents randomly logged out or unable to log in? Is it happening to more then one Agent
- Are these failures specific to agents at a particular site/network/ISP/Geo-location?
- Are there any known network issues at the location/site?
- Any recent changes to network/VPN/Firewall/proxy at customer network?
- Isolate the problem if it occurs only on a particular type of browser and version?
- If you monitor a particular agent problem collect the ping information which proves that the immediate connection Agent Desktop <> Router & Router <> ISP(internet) stayed online during the connection failure
- If the agent desktop access is via VPN check with the network team if the Agent desktop access to internet is slip tunnel or not. (Split tunnel is recommended for agent desktop URL)
- If there is no split tunnel or if agent is working from office that means the agent desktop traffic is going via customer network, have the network team make sure that there are no firewall rules which are blocking the traffic to agent desktop URL(port 443)
- If the access is via proxy servers make sure the agent desktop URL's enabled and no additional rules are included
- [More detailed network requirement document is under construction and will be available soon - keep checking this document]
|
- Exact timestamp of the issue
- Agent Information
- Screenshot of any error (ensure that all details are captured on the screen)
- Download the error report from Agent desktop application [Image 1.2]
- Information of ping tests performed on Agent desktop PC/Laptop
- Details gathered after analyzing the isolation points mentioned in the [Details to Analyze] column
- Agent desktop local details, Agents Geo-location information, network type, VPN/Non-VPN, Home/Office etc
- AAR report of Agent for the whole day who sees this problem (to provide the exact timestamps when the connection is lost)
|
|
|
|
|
|
|
Agent Desktop Agent Personal Statistics (APS) does not Load Data/Accurate Data
Image 1: APS does not load (idbroker.webex.com refused to connect).
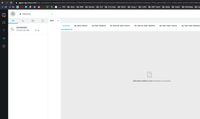
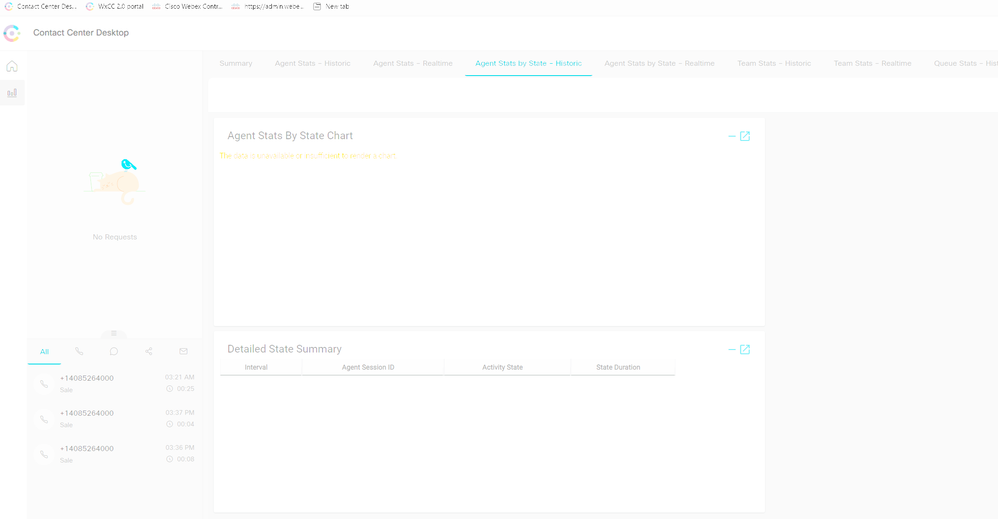
Image 2: APS does not load, "The data is unavailable or insufficient to render."
|
Image 2: APS does not load, "The data is unavailable or insufficient to render".
-
If the APS does not load data and shows "The data is unavailable or insufficient to render", this is probably because User Profile with Access rights set to specific Sites or EPs or Queues and run the dashboard - there is a workaround for this problem and the next session defines the defect to track the same Cisco bug ID CSCuv02215
|
Image 2: APS does not load (idbroker.webex.com refused to connect)
- The browser must be configured to allow third-party cookies when is run in incognito mode.
- This has been necessitated by recent changes in Chrome (from version 83) which by default block third-party cookies in incognito mode.
- Intuitive Privacy and Security Controls in Chrome
- Chrome security settings
- The Google Chrome Enterprise release notes for version 83.
- If the issue happens when the agent desktop is IDLE for a long time (more than 6 hours) this requires a re-log in to fix the problem.
|
- Is there an issue with agent personal statistics on the agent applet?
- Is the agent applet frozen?
- Is there any problem to update agent state changes?
|
- Exact timestamp of the issue
- Agent Information
- Screenshot of any error (ensure that all details are captured on the screen)
- Browser logs
- Download the client logs from Agent desktop application
- Information of ping tests performed on Agent desktop PC/Laptop
- AAR report of Agent for the whole day who sees this problem (to provide the exact timestamps when the connection is lost)
|
Capture Browser Logs
Browser logs are a great source of information to help understand browser behavior. There are times when Technical Assistance Center (TAC) asks you to provide browser logs to understand the communication and data exchange between the agent desktop and the server. Browser logs constitute Console logs and Network logs.
Download Error Report
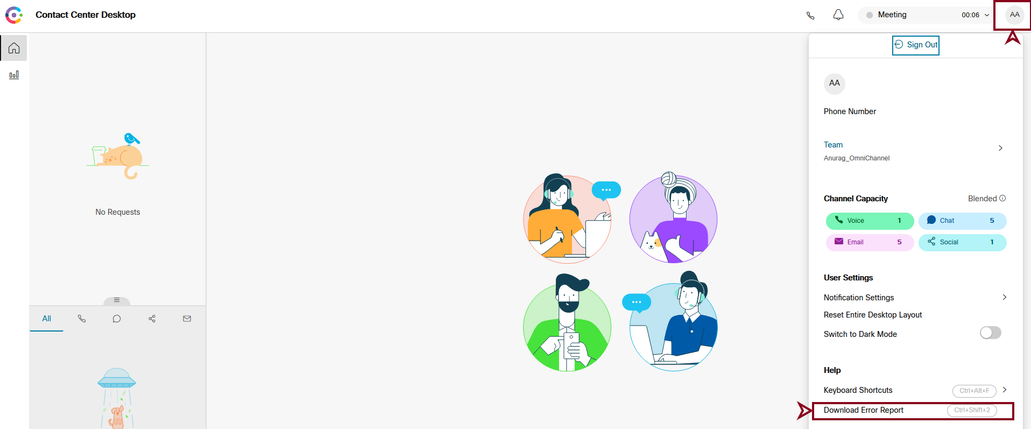
The desktop application caches logs upto 1MB in browser cache automatically and it retains the latest logs unless the browser cache is cleared. To download the error report you can choose one of the these options.
- Load the desktop page on browser and press Ctrl+Shift+2. Click Save File and Download a local copy.
- Load the desktop page on browser, click the user profile circle on the top right corner of the screen, click Download Error Report.
Enable Timestamps on Your Browser
Before you collect browsers logs (or console logs) from Chrome or Firefox, enable timestamps on your browser. This helps synchronize client and server timings.
Enable timestamps and preserve logs upon navigation
Chrome
Step 1. From the menu bar, choose View > Developer > Developer Tools.
Step 2. Click the Customize and control Dev Tools button (3 vertical dots).
Step 3. Click Settings.
Step 4. Under Preferences, check these check boxes:
- Log XML HTTPRequests
- Show timestamps
- Preserve log upon navigation
Firefox
Step 1. From the menu bar, choose Tools > Web Developer > Toggle Tools.
Step 2. Click Customize Developer Tools and Get Help.
Step 3. Click Settings (the cog button).
Step 4. Check the Enable timestamps check box.
Collect Console Logs
The console gives you information about a page while that page is open. Ultimately, the messages you see in the console either come from the web developers who built the page, or the browser itself. When someone logs a message to the console, they can indicate the importance, or severity level, of the message.
Chrome or Firefox
Step 1. Open the Developer Tools (right-click anywhere on the browser and choose inspect).
Step 2. Perform the steps of the scenario to capture.
Step 3. Navigate to the Console Tab.
Step 4. Right-click and choose Save as (notepad text file).
- Right-click and choose Select All. Right-click and choose Copy.
- Paste that into a text file.
Step 5. Attach the text files to your support ticket.
Internet Explorer (IE)
Step 1. Press the F12 key to open the Developer Tools Window.
Step 2. In the Console tab, enter the AgentSDK.EnableIE11DebugLogging(true) command to enable extra logging.
Step 3. Perform the steps of the scenario to capture.
step 4. From the Console tab, right-click and choose Copy All as shown in the image.
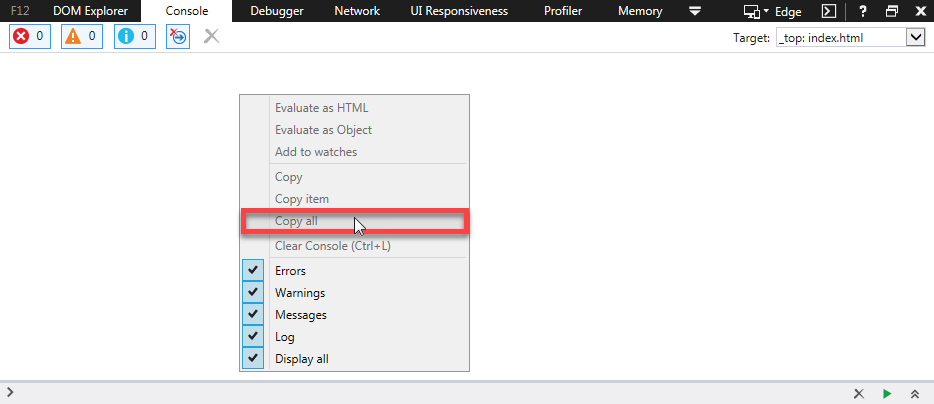
Step 5. Enter the AgentSDK.EnableIE11DebugLogging(false) command to disable extra logging.
Collect Hyper Text Transfer Protocol Archive Format (HAR) Logs
The HTTP Archive format, or HAR, is a JSON-format archive for logging of a web browser's interaction with a site.
Chrome or Firefox
Step 1. Open Google Chrome and navigate to the page where the issue occurs.
step 2. Open the Developer Tools (right-click anywhere on the browser and choose inspect).
Step 3. Look for a round Record button ( ) in the upper-left corner of the Network tab; red indicates record in is progress and grey indicates it is disabled.
Step 4. Check the Preserve log check box.
Step 5. Click the Clear button ( ) to clear out any previous logs from the Network tab.
Step 6. Perform the steps of the scenario to capture.
Step 7. Right-click anywhere on the grid of network requests, choose Save as HAR with Content or Save all as HAR, and save the file to your computer.
Microsoft Edge or Microsoft Internet Explorer
Step 1. Browse to the URL where you wish to start the capture.
Step 2. Navigate to Developer Tools (use F12 as a shortcut) and click the Network tab.
Step 3. Perform the steps of the scenario to capture.
Step 4. Click Export as HAR.
Step 5. Click Save As... to save the HAR file (or Extensible Markup Language (XML) if you use an older version of Internet Explorer).


 Feedback