Configure and Troubleshoot Live Data in a UCCE Environment
Available Languages
Download Options
Bias-Free Language
The documentation set for this product strives to use bias-free language. For the purposes of this documentation set, bias-free is defined as language that does not imply discrimination based on age, disability, gender, racial identity, ethnic identity, sexual orientation, socioeconomic status, and intersectionality. Exceptions may be present in the documentation due to language that is hardcoded in the user interfaces of the product software, language used based on RFP documentation, or language that is used by a referenced third-party product. Learn more about how Cisco is using Inclusive Language.
Contents
Introduction
This document describes the steps required to configure and troubleshoot Live Data issues in a Unified Contact Center Enterprise (UCCE) environment.
Prerequisites
Requirements
Cisco recommends that you have knowledge of these topics:
Cisco Unified Contact Center Enterprise (UCCE)
Components Used
The information in this document is based on these software and hardware versions:
ICM Version: 12.6
Finesse Version: 12.6
CUIC/Live Data Version: 12.6
The information in this document was created from the devices in a specific lab environment. All of the devices used in this document started with a cleared (default) configuration. If your network is live, ensure that you understand the potential impact of any command.
Background
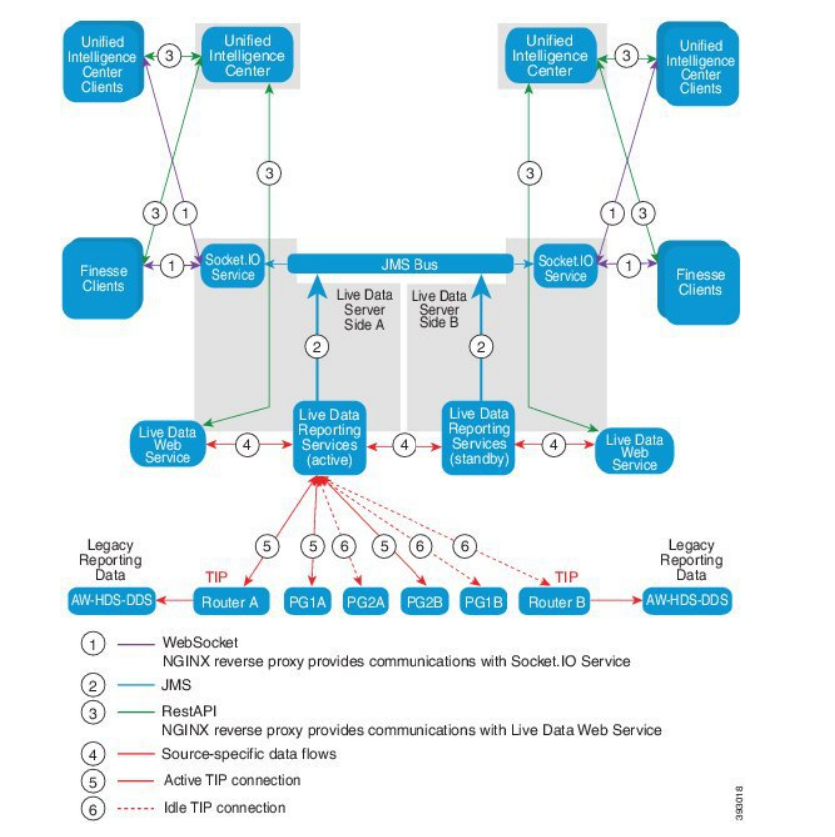
Live Data is a data framework that processes real-time events with high availability for Live Data reports. Live Data continuously processes agent and call events from the peripheral gateway and the router. As events occur, Live Data continuously pushes real-time updates to Unified Intelligence Center reporting clients. The PG and the Router push agent and call events to Live Data as the events occur. Live Data then continuously aggregates and processes the events in-stream and publishes the information. CUIC subscribes to the message stream to receive the events in real-time and continuously update Live Data reports. Individual state values, such as agent states, refresh as they happen. Other values, such as calls in queue, refresh approximately every 3 seconds.
In Unified CCE, Live Data resides on a Cisco Voice Operating System Virtual Machine (VM). You can embed Live Data reports in Finesse agent desktops.
For 2000 Agent deployments
- The Live Data server is installed on a VM with Cisco Unified Intelligence Center (CUIC) and the Cisco Identity Service (IdS)
For 4000 and higher Agent deployments
- The Live Data server is installed on a standalone VM.
Live data connectivity checks with Router and PG
The active Live Data server must establish a TIP and TOS connections to Routers and all Agent PGs. The in-active (standby) Live Data server must establish only TOS connection to Routers and all Agent PGs.
- Router/PG Port for TIP connection has the format as per this regexp: 4[0-5]034 (This assumes there is only one instance of CCE. e.g: 40034, 41034, 42034...)
- Router/PG Port for TOS connection has the format as per this regexp: 4[0-5]035 (This assumes there is only one instance of CCE. e.g: 40035, 41035, 42035...)

Note:
- The ports for TIP/TOS connections are assigned based on the order in which the PG pair (side A/B) is installed on the same server.
- For example, the first PG pair (PG1 Side A/B) installed, is assigned TIP base ports 42034 and 43034 respectively. The second PG pair (PG2 Side A/B) installed, is assigned ports 44034 and 45034 respectively. The same assignment is applicable to TOS ports as well.
- TIP and TOS ports can vary based on Instance number; for more detail refer the Port Utilization Guide for Cisco Unified Contact Center Solutions.
Live Data Server Failover
The Live Data servers work in cold-active or standby mode. Only one Live Data server is active at any time. The other Live Data server is standby. The standby Live Data server constantly monitors the status of the active server. When the active server fails, the standby server takes over and becomes active. The failing server becomes the standby server when it is ready to serve.
TIP Failover
Live Data uses the TIP transport protocol to communicate with the Router and PG servers. The active Live Data server establishes TIP connections to both sides of the Router and PGs. The standby Live Data server does not establish any TIP connections. Only one TIP connection is active at a time, either to Side A or to Side B. When the active TIP connection fails, the active Live Data server recovers to the idle TIP connection.
SocketIO Failover
A SocketIO client connects to either side of the Live Data server to receive the Live Data report event stream (SocketIO stream). Unified Intelligence Center clients are an example of a SocketIO client. The standby Live Data server also produces the SocketIO stream by proxy from the active server. SocketIO client heartbeat losses result in a SocketIO connection failure. The SocketIO client then fails over to the other Live Data server.
Pre-configuration Checks
Prior to deploying Live Data, perform these checks:
Check 1
From the ICM servers, verify the Forward and Reverse DNS Lookup for the Live Data Publisher and Subscriber, using the nslookup command.
nslookup <Live-Data-Server-FQDN>
nslookup <Live-Data-Server-IP>
Check 2
From the Live Data Server CLI, verify the Forward and Reverse DNS lookup for the Routers and PGs (perform checks for A side and B side).
utils network host <FQDN>
Replace <FQDN> with the public FQDNs of the Routers/PGs
utils network host <IP>
Replace <IP> with the public IP address of the Routers/PGs (perform checks for both A side and B side)
Check 3
Verify the NTP configurations and requirements for a CCE environment. Refer to the NTP and Time Synchronization section in the CCE Solution Design Guide.
Check 4
Ensure configuration limits are being followed as per the CCE Solution Design Guide
- Agent and Supervisor limits such as: Configured Agents per PG, Agents per team, Number of agents is a skill group and such. Refer to the CCE Solution Design Guide for more details.

Note:
- If Live Data servers are not deployed as per the Design guide (co-resident vs standalone) or if the configuration limitations are exceeded, Live Data service can stay out of service.
- To avoid issues with Live Data service, it is recommended that the Live Data Server version match the exact ICM version for that deployment.
Check 5
Certificate exchange for Live Data in a UCCE deployment

Note: If CA-signed certificates are being used across the CCE deployment - ICM, Finesse, CUIC, LD and IdS - (signed by the same Certificate Authority), this check can be skipped.
When using self-signed certificates
For 2000 Agent Deployments
- Ensure the tomcat certificates from the CUIC-LD-IdS Publisher and Subscriber servers are uploaded to the Finesse Publisher as tomcat-trust
- Ensure the tomcat certificates from the Finesse Publisher and Subscriber servers are uploaded to the CUIC-LD-IdS Publisher server as tomcat-trust.
- Ensure the tomcat certificates from the CUIC-LD-IdS Publisher and Subscriber servers are uploaded to all AW servers.
For 4000 and 12000 Agent Deployments
- Ensure the tomcat certificates from the Live Data Publisher and Subscriber servers are uploaded to the CUIC Publisher and the Finesse Publisher as tomcat-trust.
- Ensure the tomcat certificates from the CUIC Publisher and Subscriber servers are uploaded to the Live Data Publisher and the Finesse Publisher as tomcat-trust.
- Ensure the tomcat certificates from the Finesse Publisher and Subscriber servers are uploaded to the CUIC Publisher and the Live Data Publisher as tomcat-trust.
- Ensure the tomcat certificates from all CUIC, Live Data and Finesse servers are uploaded to all AW servers.
- Ensure the AW servers' IIS certificate is uploaded to the Live Data Publisher server as tomcat-trust.

Note:
- Certificates uploaded as tomcat-trust to the Publisher server get replicated over to the Subscriber node in that same cluster.
- When a certificate is uploaded to a VOS server, a full restart of the server using the CLI command utils system restart is required for the newly uploaded certificate to take effect on that server.
- For AW servers, a restart of the Apache Tomcat service is required for the newly uploaded certificate to take effect on that AW server.
Check 6
You MUST use fully qualified domain name (FQDN) for all Live Data configuration commands. Using IP address when configuring Live Data can cause issues with the Live Data service.
Check 7
a. For all of the set Live Data commands, manually type in the passwords instead of a copy-and-paste action.
b. Supported Character Set for Live Data Installation CLI Commands
When working with the CLI (and not exclusively for Live Data), you can use plain alphanumeric characters [0-9] [A-Z] [a-z] and these additional characters:
- ". " (dot)
- "!" (exclamation mark)
- "@" (at sign)
- "#" (number sign)
- "$" (dollar)
- "%" (percent)
- "^" (caret)
- "*" (star)
- "_" (underscore)
- "+" (plus sign)
- "=" (equal sign)
- "~" (tilde)
- ":" (colon)
- "(" and ")" (open and close parentheses)
- "{" and "}" (open and close brackets)
- "[" and "]" (open and close square brackets)
- Spaces are used as input separators. Most special characters carry specific meaning to the Cisco Voice Operating System (VOS) command console (for example, "\", "|", and so on). Characters apart from standard ASCII are mostly ignored.
Live Data configuration steps for UCCE deployments
Step 1
Ensure the correct deployment type is set on CCE Administration under Infrastructure > Deployment Settings (https://<AW-Server>/cceadmin).
Step 2
Add server to the CCE Inventory.
For 2000 Agent deployments, add the co-resident CUIC-LD-IdS cluster by selecting the CUIC-LD-IdS Publisher option.

For 4000 and higher Agent deployments, add the standalone CUIC cluster by selecting the Unified Intelligence Center Publisher option.


Note: For 4000 and higher agent deployments, the Live Data servers are added to Inventory using the set live-data machine-services command.
Step 3
Use the set live-data reporting-interval <reporting-interval-in-minutes> command to set the Live Data reporting interval in minutes.
- Valid intervals are: 5 (default), 10, 15, 30 and 60.
- A restart of the Live Data cluster is required if and when this value is modified.
Use the show live-data reporting-interval command to view the current reporting interval setting.
Step 4
Configure a SQL user on the AW DB to work with Live Data
On the primary and the secondary AW DB server > start SQL Server Management Studio (SSMS):
- Create a user with db_datareader and db_datawriter database role membership under the User Mapping setting of the awdb database.
- The database role public is checked by default. This role is required for CUIC, Finesse, and Live Data users.
Step 5
Execute the SQL query for the SQL user configured to work with Live Data.
USE master
GO
GRANT CONTROL ON CERTIFICATE :: UCCESymmetricKeyCertificate TO "<user>"
GRANT VIEW DEFINITION ON SYMMETRIC KEY :: UCCESymmetricKey TO "<user>"
Replace <user> with the username of the user created in Step 4.
Step 6
Configure Live Data with AW
set live-data aw-access primary <aw1-server-fqdn> <port> <aw-database> <sql-user>
set live-data aw-access secondary <aw2-server-fqdn> <port> <aw-database> <sql-user>
Where
- port: SQL port (by default SQL Server Database Engine listens on TCP port 1433)
- aw-database: awdb
- sql-user: SQL user created on the AW DB (step 4)
This command tells Live Data how to access the primary AW DB and the secondary AW DB. The command also automatically tests the connection from Live Data to the primary or secondary AW, checks to see if the configured user has appropriate AW DB access, and reports the results. (Test status must show 'Succeeded'). You do not need to configure the AW DB on both the Live Data Publisher and the Subscriber servers. The configuration is replicated between the Live Data Publisher and Subscriber node.
To view the configured primary and secondary AW DBs, use the command:
show live-data aw-access
Step 7
Connect Live data servers to Machine Service records (only for 4000 and higher Agent deployments)
set live-data machine-services <user@domain>
This command allows the LD servers to register themselves to the machines services table so that LD servers are discoverable. This also registers the credentials for calling Live Data API.
Requirements that the user must have to execute the machine services command successfully:
- Must be a domain user.
- Must be in a User Principal Name (UPN) format. Example: admin@stooges.cisco.com
- Must have write-access permission over the Machine tables.
- Must be authorized to change Unified CCE configuration.

Note:
- When you run this command, it prompts you to specify the login password for user@domain, to use for authentication with AW database access. It also prompts you to specify the password of the logged in user for the current CLI session.
- For 2000 Agent deployments, the Live Data service being part of a co-resident cluster, gets added to the Inventory when the co-resident nodes are added by selecting the 'CUIC-LD-IdS Publisher' option in Step 2. And thereby not needing a 'set live-data machine-services <user@domain>' command.
Step 8
Set up the Live Data datasource in CUIC.
set live-data cuic-datasource <cuic-fqdn> <cuic-port> CUIC\<cuic-user>
Where
- cuic-port = 8444
- cuic-user = CUIC Application User (SuperUser login credentials)
Once this command is run successfully, the primary and secondary Live Data datasources can be seen under the Datasources tab on the CUIC GUI.
To view Live Data datasource configuration, use the command:
show live-data cuic-datasource <cuic-fqdn> <cuic-port> CUIC\<cuic-user>
Step 9
Download the Live Data reports from cisco.com and import the Live Data reports onto the CUIC server.

Note: The Live Data reports MUST match the version of your central controller.
Step 10
In the Cisco Finesse Administration page (https://<Finesse>/cfadmin), navigate to the Finesse Desktop Layout tab and replace the default 'my-cuic-server' with the correct CUIC Server FQDN.
Step 11
Configure Cross Origin Resource Sharing (CORS) for Live Data
a. On Finesse Publisher and Subscriber, ensure CORS is enabled using the command utils finesse cors status.
If this is disabled, you can enable it using the command utils finesse cors enable.
b. Execute the CORS commands on all CUIC servers:
utils cuic cors enable
utils cuic cors allowed_origin add https://<finesse-publisher>
utils cuic cors allowed_origin add https://<finesse-subscriber>
utils cuic cors allowed_origin add https://<finesse-publisher>:8445
utils cuic cors allowed_origin add https://<finesse-subscriber>:8445
c. Execute the CORS commands on the Live Data Publisher and Subscriber servers:
utils live-data cors enable
utils live-data cors allowed_origin add https://<finesse-publisher>
utils live-data cors allowed_origin add https://<finesse-subscriber>
utils live-data cors allowed_origin add https://<finesse-publisher>:8445
utils live-data cors allowed_origin add https://<finesse-subscriber>:8445
d. To verify the CORS configuration:
On all CUIC Servers:
utils cuic cors status
utils cuic cors allowed_origin list
On Live Data Publisher and Subscriber:
utils live-data cors status
utils live-data cors allowed_origin list

Note:
- For co-resident deployments, the utils cuic cors and utils live-data cors set of commands need to be executed on the co-resident Publisher and Subscriber servers.
- For standalone deployments, the utils cuic cors set of commands must be run on all CUIC nodes in the CUIC cluster and the utils live-data cors set of commands must be run on the Live Data Publisher and Subscriber servers.
Step 12
Restart all CUIC/LD and Finesse servers using the CLI command:
utils system restart
Troubleshooting checklist
Step 1: Verify Live Data Service status
Ensure all Live Data services are STARTED using the command 'utils service list'.
CCE Live Data ActiveMQ Service[STARTED]
CCE Live Data Cassandra Service[STARTED]
CCE Live Data Event Store Service[STARTED]
CCE Live Data SocketIO Service[STARTED]
CCE Live Data Storm DRPC Service[STARTED]
CCE Live Data Storm Nimbus Service[STARTED]
CCE Live Data Storm Supervisor Service[STARTED]
CCE Live Data Web Service[STARTED]
CCE Live Data Zookeeper Service[STARTED]
Step 2: Verify Live Data connectivity to AW
Ensure connectivity to the AW servers using the command:
show live-data aw-access
Test status must show 'Succeeded'.
Step 3: Verify Live Data cluster state using command - show live-data failover
Verify the Live Data Cluster state using the command
show live-data failover
| Cluster State | Description |
|
PAIRED-ACTIVE |
The Live Data server is in the active state and is communicating with the remote side. |
|
PAIRED-STANDBY |
The Live Data server is in the standby state and is communicating with the remote side. |
|
ISOLATED-ACTIVE |
The Live Data server is in the active state, but is unable to communicate with the remote side. |
|
ISOLATED-STANDBY |
The Live Data server is in the standby state, but is unable to communicate with the remote side. |
|
SIMPLEXED-MODE |
The Live Data server is working in simplex mode. |
|
OUT-OF-SERVICE |
The Live Data server is out of service. |
|
CONNECTING |
The Live Data server is attempting to do a handshake with the remote side. |
|
TESTING |
The Live Data server is unable to communicate with the remote side and is using the Test-Other-Side procedure to determine whether to be in the ISOLATED-ACTIVE or ISOLATED-STANDBY state. |
|
UNAVAILABLE |
Live Data is not deployed. |

Note: ISOLATED active/standby status indicates a communication between Live Data servers. This does not cause Live Data datasource on CUIC to be offline.
a. If the 'show live-data failover' command shows cluster state as UNAVAILABLE.
- This status indicates that Live Data has not been deployed successfully due to incomplete configurations.
Action Items:
- Ensure all of the configuration steps have been successfully completed.
- Download the CCE Live Data Storm Services logs using RTMT and analyze the deployment_control.log file
- Alternatively, you can download the file using the CLI command file get activelog livedata/logs/livedata-storm/deployment_control.log
b. If the 'show live-data failover' command shows cluster state as OUT-OF-SERVICE.
- This status indicates that Live Data is deployed successfully, but there can be connectivity issues, or the configuration limits have been exceeded.
Action Items
- Ensure network connectivity between the Live Data servers and the Routers/PGs (Refer to the CCE Port Utilization Guide)
- Ensure that the Live Data server has been deployed as per the design guide (co-resident vs standalone)
- Ensure configuration limits have NOT been exceeded.
- Download and analyze the CCE Live Data Storm Services logs (primarily the worker.log file)
- Alternatively, you can download the log file using the CLI command file get activelog livedata/logs/livedata-storm/
c. If the 'show live-data failover' command shows cluster state as ISOLATED.
- This status indicates a connectivity issue between the two Live Data servers due to which they are unable to communicate with each other.
Step 4: Verify Live Data Datasource configuration
Ensure the Streaming Live Data Datasource reflects the correct hosts using the command:
show live-data cuic-datasource <cuic-fqdn> <cuic-port> CUIC\<cuic-user>
Step 5: Verify Live Data Datasource status on CUIC
If the 'show live-data cuic-datasource' shows the correct configurations, but Live Data Datasource shows offline on CUIC:
- Ensure the Live Data Web Service and Live Data SocketIO Service ports are opened bi-directionally between the Live Data server and the browser.
- The CCE Live Data Storm Services, CCE Live Data SocketIO Service and the Browser Console logs can help further isolate the possible cause of the issue.

Note: Starting Live Data version 12.6.2, the ports 12005 and 12008 are deprecated and removed in future releases. The port 443 is now used for Live Data Web Service and Live Data SocketIO Service.
Step 6: Verify Port Connectivity on Live Data servers
Verify port connectivity from the Live Data Server CLI using the show open ports command.
- The output from the active Live Data Server must show 2 established connections to each of the Routers and the Agent PGs (for the TIP and TOS connections).
- The output from the in-active (standby) Live Data Server must show 1 established connection to the Routers and the PGs (for the TOS connections).
show open ports regexp 4[0-5]03[45] (For Instance-0)
show open ports regexp 4[0-5]07[45] (For Instance-1)
Step 7: Verify Port Connectivity on ICM servers
Verify port connectivity from the command prompt on the Routers and PGs using the netstat command.
- The output must show ports in ESTABLISHED state to the Live Data Publisher and Subscriber.
- The output must show 2 ESTABLISHED connections to the Active Live Data server (for the TIP and TOS connections).
- The output must show 1 ESTABLISHED connection to the in-active (standby) Live Data server (for the TOS connections).
netstat -an | findstr "<LD-SideA-IP> <LD-SideB-IP>"
OR
netstat -an | findstr 4[0-5]03[45] (For Instance-0)
netstat -an | findstr 4[0-5]07[45] (For Instance-1)
a. If the ports do not even show to be in the LISTENING state:
- Check if the correct and supported deployment type is set per the design guide.
- A restart of the server can be needed.
b. If the ports are not in the ESTABLISHED state and continue to be in the LISTENING state:
- Verify network connectivity between the Routers/PGs and the Live Data servers.
- From the Routers/PGs, verify forward and reverse DNS lookups for the Live Data server.
- From the LiveData servers, verify forward and reverse DNS lookups for the public addresses of the Router/PG server.
Step 8: Additional checks
a. SQL query to check for number of Agents configured per team:
Run query against the awdb (No production impact)
Select TeamName = AT.EnterpriseName, NumAgentsOnTeam = COUNT(ATM.SkillTargetID), SupervisorName = Person.LastName + ', ' + Person.FirstName
FROM Agent_Team AT LEFT OUTER JOIN
(Select * from Agent ) Agent ON AT.PriSupervisorSkillTargetID = Agent.SkillTargetID LEFT OUTER JOIN Person ON Person.PersonID = Agent.PersonID,
Agent_Team_Member ATM
WHERE ATM.AgentTeamID = AT.AgentTeamID
GROUP BY AT.EnterpriseName, Person.LastName + ', ' + Person.FirstName
ORDER BY AT.EnterpriseName
b. SQL query to check for number of Agents configured per skill group:
Run query against the awdb (No production impact)
Select Skill_Group.EnterpriseName, NumAgentsInSG = COUNT(Skill_Group_Member.AgentSkillTargetID)
FROM Skill_Group, Skill_Group_Member
WHERE Deleted = 'N' AND Skill_Group.SkillTargetID = Skill_Group_Member.SkillGroupSkillTargetID
GROUP BY EnterpriseName;
c.
If Live Data issues are seen after an upgrade, check the 'DBMaintenance' configuration value.
- 0 - enabled
- 1 - disabled.
If it is disabled, enabling the configuration changes by setting DBMaintenance to 0 and restart the Apache Tomcat service on the AW Server.
Registry path: HKEY_LOCAL_MACHINE\SOFTWARE\Cisco Systems, Inc.\ICM\<instance name>\Router<A/B>\Router\CurrentVersion\Configuration\Global\DBMaintenance.
Logs required to troubleshoot Live Data issues
From the ICM Servers
- Set the trace setting for the rtr and opc process to either level 1 or level 2, depending on how detailed you want the logs to be.
Router
- rtr logs
PG
- opc logs
From the LiveData Servers
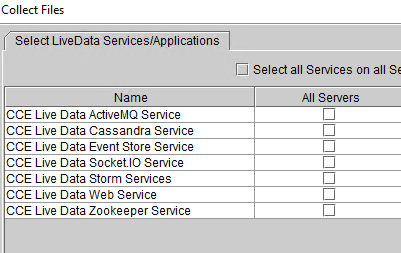
Using RTMT
Using CLI

file get activelog livedata/logs recurs compress
This command collects logs for all of the Live Data components
Alternatively, you can collect logs for the individual Live Data components as well.
CCE Live Data ActiveMQ
file get activelog livedata/logs/livedata-activemq

CCE Live Data Cassandra Service
file get activelog livedata/logs/livedata-cassandra

CCE Live Data Event Store Service
file get activelog livedata/logs/livedata-event-store

CCE Live Data SocketIO Service
file get activelog livedata/logs/socketio-service

CCE Live Data Storm Services
file get activelog livedata/logs/livedata-storm

CCE Live Data Web Service
file get activelog livedata/logs/livedata-web

CCE Live Data Zookeeper Service
file get activelog livedata/logs/livedata-zookeeper
From the CUIC Servers
Using RTMT
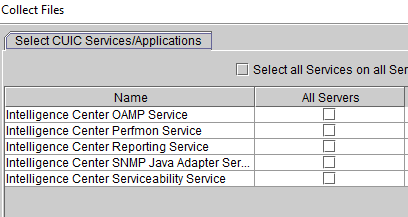
Using CLI
Intelligence Center Reporting Service
file get activelog cuic/logs/ recurs compress
Browser Console and Network Logs
Collect Browser Console & Network logs for the duration issue. Begin with clearing the Cache, restart the browser and capture the logs from the login time onwards, covering the attempt made to reproduce the issue
For the Chrome/Edge browser:
- Click on the Settings icon and navigate to Developer tools > More tools > Developer tools.
- On Developer tools > Console tab, click on the gear symbol and check the options: Preserve log, Show timestamps, Log XMLHttpRequests.
- On Developer tools > Network tab, click on the gear symbol and check the option: Preserve log.
- Close the settings page.
- The console and network logs can now be collected by right-clicking on the respective tabs and select Save all as.
For the Firefox browser:
- Click on the Applications menu icon and navigate to More tools > Web Developer tools.
- In Network tab, click on the gear symbol and select the option: Persist Logs.
- The console and network logs can now be collected by right-clicking on the respective tabs and select Save all as.
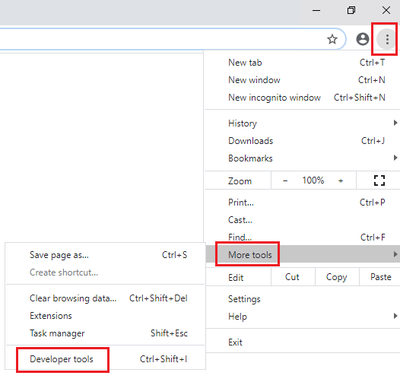 Chrome
 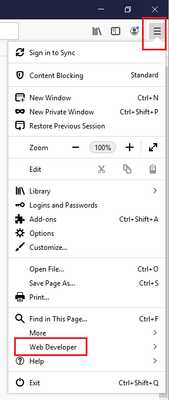 Firefox
Packet Capture
Command to run Packet Captures on VOS Servers:
- utils network capture eth0 file <enter_file_name> count 10000000 size all
- utils network capture-rotate eth0 file <enter_file_name> count 1000000 size all (for log-rotate)
Collect Packet Captures using RTMT:
- Navigate to System > Trace & Log central > Collect files > Packet Capture Logs (on the 2nd page of RTMT)

Collect Packet Captures using CLI:
- file get activelog /platform/cli/*.cap*
Packet captures remains on disk until deleted. It is recommended to delete these captures periodically.
- In order to list all captures, run file list activelog platform/cli/*.cap*
- In order to download captures, run file get activelog platform/cli/*.cap*
- In order to delete captures, run file delete activelog platform/cli/*.cap*
Related Information
12.6(1)
Solution Design Guide
Install and Upgrade Guide
Revision History
| Revision | Publish Date | Comments |
|---|---|---|
1.0 |
14-Feb-2024 |
Initial Release |
Contributed by Cisco Engineers
- Joshua Raja
Contact Cisco
- Open a Support Case

- (Requires a Cisco Service Contract)
 Feedback