Introduction
This document describes how to collect a packet capture from a Cisco Microsoft Teams Room (MTR) device.
Prerequisites
Components Used
The information in this document is based on these software and hardware versions:
The information in this document was created from the devices in a specific lab environment. All of the devices used in this document started with a cleared (default) configuration. If your network is live, ensure that you understand the potential impact of any command.
Background
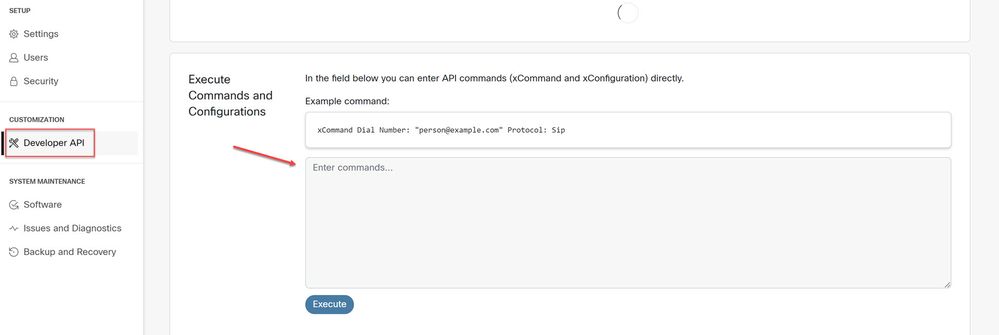
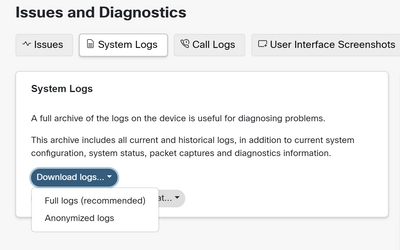
When a Cisco endpoint is onboarded to Microsoft Teams, the ability to capture network traces from the Issues and Diagnostics > System Logs menu has been intentionally disabled. It is still possible to collect network traces by using the Developer API in the graphical user interface (GUI) if only registered to MS Teams, or using command line of the endpoint when it is dual registered with Microsoft and Webex Control Hub.

Note: You must have the admin password that was generated or created during the onboarding process if only performing Microsoft registration. This password is created while using the MTR wizard and offers you the chance to change it at that time.
 Developer API
Configure
Start the capture:
xcommand logging extendedlogging start packetdump:<PICK ONE> PacketDumpRotateSize:<PICK ONE>
(options are full, fullrotate, limited)
Examples:
xcommand logging extendedlogging start packetdump:full < captures everything for 3 minutes.
xcommand logging extendedlogging start packetdump:limited < captures limited data. Does not capture any real-time transport protocol (RTP).
xcommand logging extendedlogging start packetdump:fullrotate < captures everything for up to one hour, 12MB each only keeping last 2 pcap files.
xcommand logging extendedlogging start packetdump:fullrotate packetdumprotatesize:Large < captures everything up to 1 hour, 150MB each, and keeps last 2 pcaps only.
Stop the capture:
xcommand logging extendedlogging stop
(This is not necessary for Full or Limited captures, but fullrotate runs for one hour unless stopped)
Collect the traces:
Log into the GUI of the codec, or collect from Control Hub, and find the packet capture in the Run folder.
 System Logs Menu


 Feedback