Configure Prime Collaboration Assurance (PCA) - Conference Diagnostics
Available Languages
Download Options
Bias-Free Language
The documentation set for this product strives to use bias-free language. For the purposes of this documentation set, bias-free is defined as language that does not imply discrimination based on age, disability, gender, racial identity, ethnic identity, sexual orientation, socioeconomic status, and intersectionality. Exceptions may be present in the documentation due to language that is hardcoded in the user interfaces of the product software, language used based on RFP documentation, or language that is used by a referenced third-party product. Learn more about how Cisco is using Inclusive Language.
Contents
Introduction
This document describes how to configure and set-up your deployment for Conference Diagnostics within Prime Collaboration Assurance (PCA) to proactively monitor voice/video conference statistics.
Prerequisites
Requirements
Cisco recommends that you have knowledge of these topics:
- Call Manager Admin log in
- PCA Log in
- Your Telepresence Monitor Server (TMS)
- Core/Expressway credentials, if applicable
Components Used
The information in this document is based on PCA versions 11.x - 12.x.
The information in this document was created from the devices in a specific lab environment. All of the devices used in this document started with a cleared (default) configuration. If your network is live, make sure that you understand the potential impact of any command.
Background Information
Cisco Prime Collaboration 11.x supports these types of visibility:
-
Full Visibility - Call detection with the use of JTAPI/ HTTP feedback and real-time monitoring information such as conference statistics, and conference information is supported.
-
Limited Visibility - Automatic call detection with the use of JTAPI/ HTTP feedback takes place, but real-time monitoring information such as conference statistics, and conference information is not supported. Endpoints with limited visibility are indicated with a half-dimmed icon in the Conference Topology.
Cisco Prime Collaboration 12.x supports these types of visibility:
- Full Visibility - Call detection with the use of JTAPI/ HTTP feedback and real-time monitoring information such as conference statistics, and conference information is supported.
- No Visibility - Call detection with the use of JTAPI/ HTTP feedback and real-time monitoring information are not supported. These endpoints are displayed on the Conference Monitoring page with a fully dimmed icon.
Limitation of Endpoints Set to Limited or Full Visibility Per OVA
- Small Open Virtualization Archive (OVA) supports up to 500 Endpoints
- Medium OVA supports up to 1000 Endpoints
- Large OVA supports up to 1800 Endpoints
- Very Large OVA supports up to 2000 Endpoints
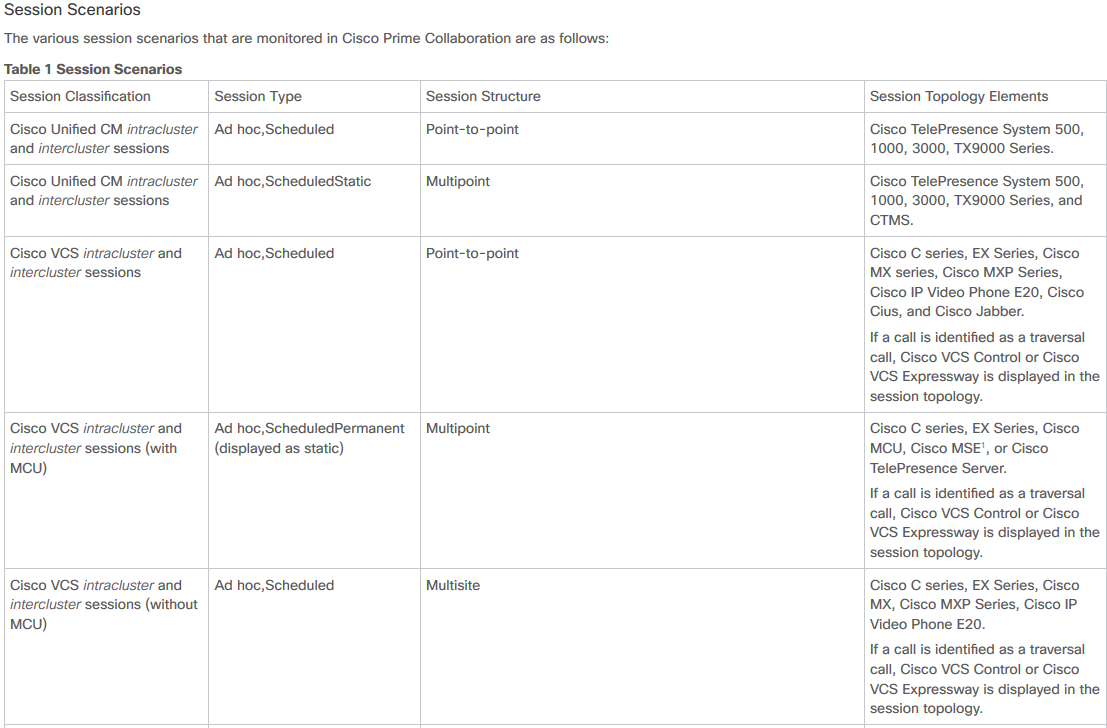
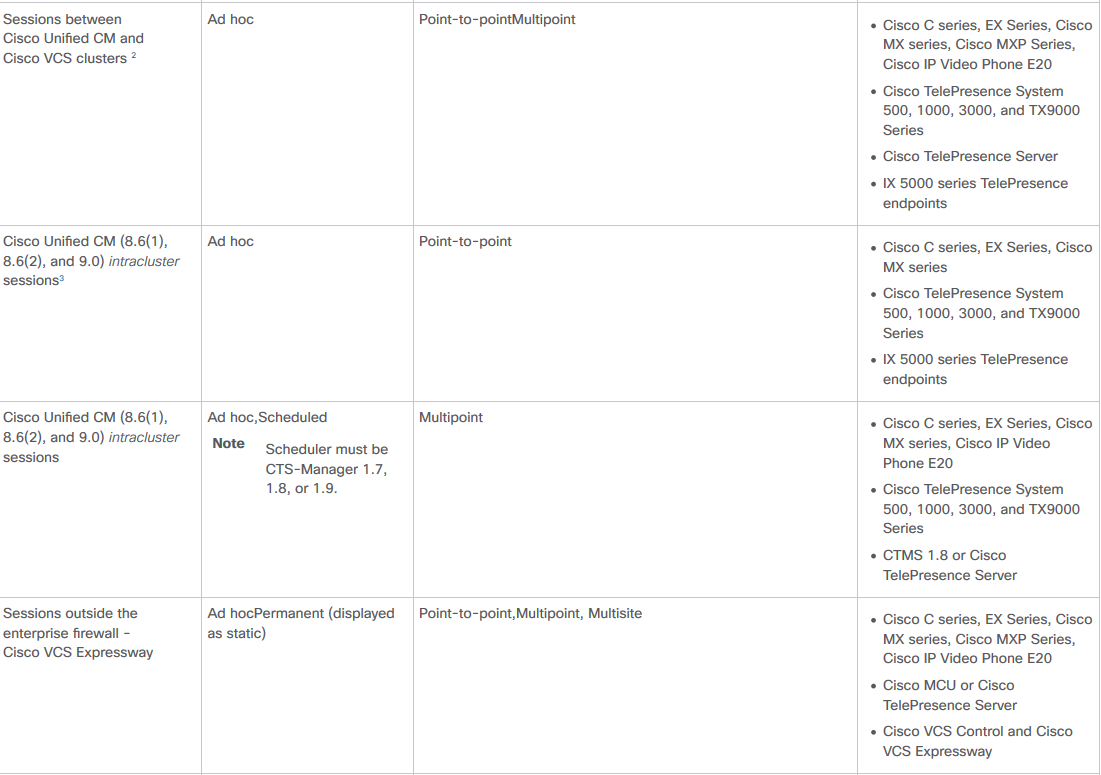
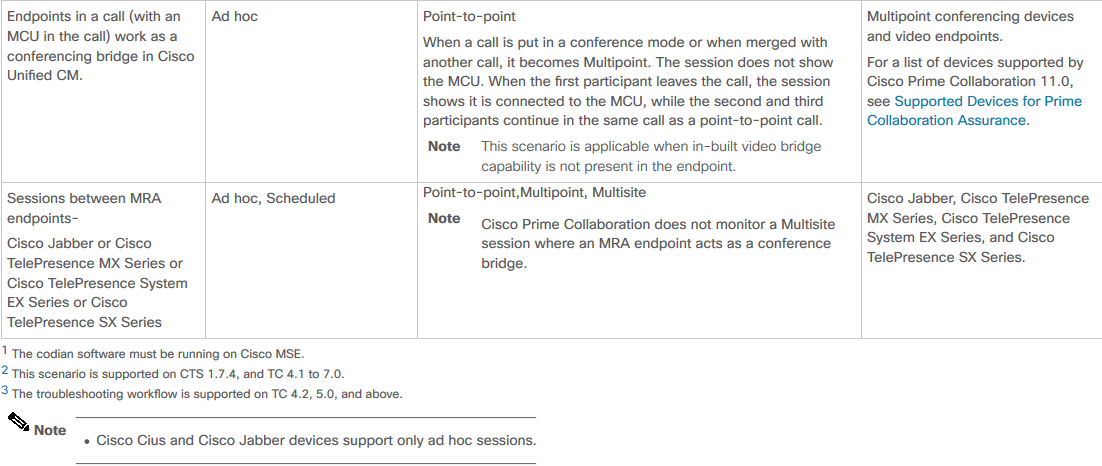
A list of supported devices per PCA in regards to conferences and our supported sessions is as shown in the table image here.
Configure
Scenario 1. Conference with Video Endpoints Registered to Call Manager
Step 1. First you need to ensure the Call Managers are in a Managed state.
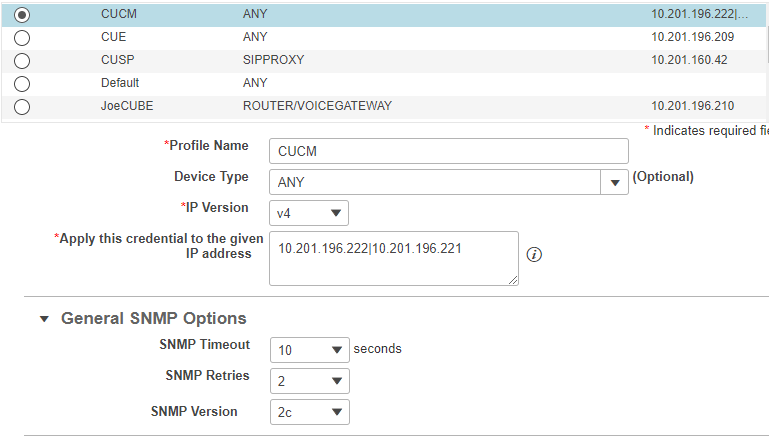
Navigate to Inventory > Inventory Management > Manage Credentials > Create a profile for the Call Manager cluster.
Note: Remember each credential profile uses the same credentials for every ip listed within the profile. So, if you list the Call Manager Publisher and Subscriber within the same Credential Profile, it uses those same credentials to discover both ip addresses. If you do have a conductor in your setup, discover the conductor first then the Cisco Call Manager as shown in the image.
Step 2. Ensure you have setup Hypertext Transfer Protocol (HTTP), Simple Name Management Protocol (SNMP) and Java Telephony API (JTAPI) Credentials
In addition, you have to enable the Cisco Computer Telephony Integration (CTI) Service in Call Manager Serviceability.
Cisco Unified Communications Manager Set-Up
Enable HTTP
You do not have to create a new user if you want to allow Cisco Prime Collaboration to use admin credentials to log in. Alternatively, if you want to allow Cisco Prime Collaboration Manager to use the right credentials to log into Cisco Unified Communications Manager, you must create a new HTTP user group and a correspondant user that Cisco Prime Collaboration can use to communicate.
In order to create a user follow these steps:
Step 1. Log into the Cisco Unified CM Administration web interface with your administrator account.
Step 2. Create a user group with sufficient privileges. Navigate to User Management>User Settings>Access Control Groupand create a new user group with a suitable name, PC_HTTP_Users in this case. Now, selectSave.
Step 3. Navigate to User Management>User Settings>Access Control Group and selectFind. Find the group you defined and click on the icon on the right.
Step 4. SelectAssign Role to Groupand select these roles:
- Standard AXL API Access
- Standard CCM Admin Users
- Standard SERVICEABILITY Administration
Step 5. Click Save.
Step 6. From the main menu, navigate toUser Management>Application Users>Create a new user.
Specify a suitable password on theApplication User Configurationpage. You can select only certain type of devices from the Available Devices text area, or allow Cisco Prime Collaboration to monitor all devices
Step 7. In thePermission Informationsection, selectAdd to User Groupand select the group that was created in Step 1. (for example, PC_HTTP_Users).
Step 8. ClickSave. The page is refreshed and the right privileges are displayed.
Enable SNMP
SNMP is not enabled in Cisco Unified Communications Manager by default.
In order to enable SNMP:
Step 1. Log into theCisco Unified Serviceabilityview in the Cisco Unified Communications Manager web GUI.
Step 2. Navigate to Tools > Service Activation.
Step 3. Select Publisher Server.
Step 4. Navigate to Performance > Monitoring Services and select the check box for Cisco Call Manager SNMP Service.
Step 5. Select Save at the bottom of the screen.
In order to Create a SNMP community string:
Step 1. Log into theCisco Unified Serviceabilityview the Cisco Unified Communications Manager web GUI.
Step 2. From the main menu in the Cisco Unified Serviceability view, navigate toSNMP > v1/v2c > Community String.
Step 3. Select a Server and clickFind.
If the community string is already defined, the Community String Name is displayed in the Search Results.
Step 4. ClickAdd newto add a new string if no results are displayed.
Step 5. Specify the required SNMP information and save the configuration.
Note: Only SNMP Read Only (RO) Access is needed.
Start CTI Service
Perform the procedure for the Cisco Unified Communications Manager node you desire, it is preferable to set on two nodes.
Step 1. Log into the Cisco Unified Serviceability, viewed in the Cisco Unified Communications Manager graphical user interface.
Step 2. Navigate toTools > Service Activation.
Step 3. Select a server from the drop-down list.
Step 4. From the CM Services section, check theCisco CTI Managercheck box.
Step 5. Select Save at the top of the screen
Create Application User for PCA CTI Control (JTAPI User)
JTAPI is used to retrieve the session status information from the device. You must create an Application user for CTI Control in the call processor with the required permission to receive JTAPI events on endpoints. Prime Collaboration manages multiple call processor clusters. You must ensure that the cluster IDs are unique. Create a new Application user to help Cisco Prime Collaboration get the required information.
In order to create a new JTAPI Application user follow these steps:
Step 1. Log into the Cisco Unified CM Administration web interface through your administrator account.
Step 2. Create a user group with sufficient privileges. Navigate to User Management>User Settings>Access Control Groupand create a new user group with a suitable name, PC_HTTP_Users in this case. Now, selectSave.
Step 3. Choose User Management>User Settings>Access Control Group and clickFind. Find the group you defined and select the icon on the right.
Step 4. ClickAssign Role to Groupand select these roles:
- Standard CTI Allow Call Monitoring
- Standard CTI Enabled
- Standard CTI Allow Control of Phones supporting Connected Xfer and conf
Step 5. SelectSave.
Step 6. From the main menu, navigate toUser Management>Application Users>Create a new user.
Specify a suitable password on theApplication User Configurationpage. You can select certain type of devices from the Available Devices text area, or allow Cisco Prime Collaboration to monitor all devices.
Note: The password must not contain a semicolon (;) or equals (=).
Step 7. In thePermission Informationsection, selectAdd to Access Control Groupand select the group that was created in Step 1. (for example, PC_HTTP_Users).
Step 8. ClickSave. The page is refreshed and the right privileges are displayed.
Note: If the Call Manager was managed prior to the add of the JTAPI User, ensure the JTAPI user is added in the Credential Profile for the Call Manager and rediscover it.
Continued from Scenario 1. Steps:
Step 3. Navigate to the Call Manager JTAPI Application user you created, and move the supported endpoints from Available Devices to Controlled Devices.
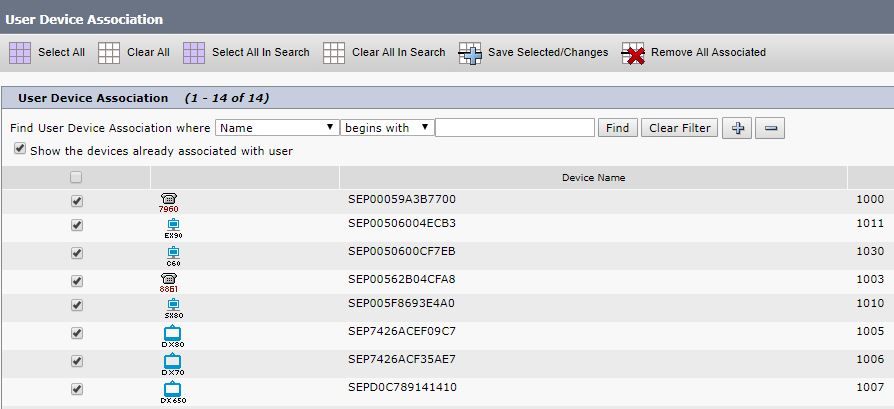
You can perform this by the Device Association function as shown in the image.
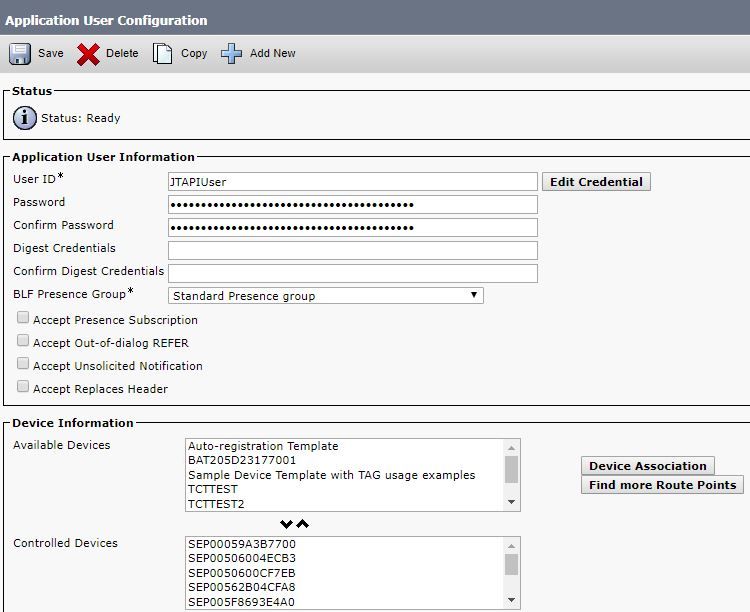
If you refer back to the limitation of Endpoints Set to Limited or Full Visibility Per OVA you can verify the amount of devices you have added to the OVA size.
Within this screen, you can filter by Device Name, Description or Directory Number to help you manage and filter these devices as shown in the image.
It is useful to note these devices as it is added in Step 7.
Ensure as well the correct User Roles are added for this JTAPI User:
- Standard CTI Allow Call Monitoring
- Standard CTI Enabled
- Standard CTI Allow Control of Phones supporting Connected Xfer and conf as shown in the image.

For a list of supported devices per PCA, in regards to conferences and our supported sessions, refer back to Background Information section.
Note: Additionally, ensure that the devices controlled by the CTI Application User have the Allow Control of Device from CTI check box checked under device information as shown in the image.

Note: It is important to note before you proceed that if you do have the endpoints registered to Call Manager and Call Manager is integrated with VCS/TMS, then you discover your VCS/TMS first, then discover your Call Manager last. This way from the inventory perspective, all of your infrastructure is mapped to the correct location. In addition, when you Discover the VCS/TMS ensure you change the default Discover tab to the respective device of TMS/VCS or Call manager.
Step 4. Next in PCA, select Device Discovery and input in the IP Addresses of your Call Managers, select the two check boxes on Auto-Configuration and select Run Now as shown in the image.
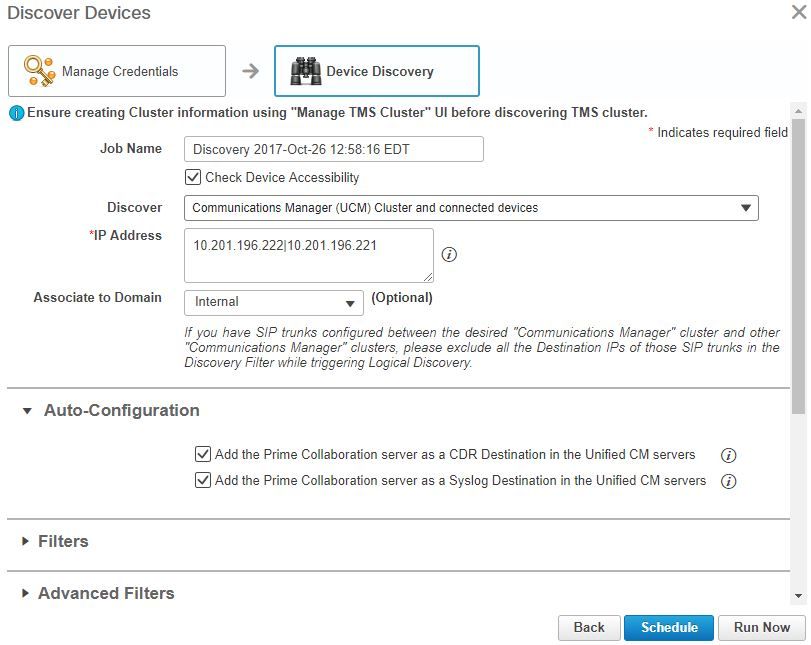
Step 5. After the Call Managers are in a Managed state, proceed to Step 6.
Note: If the Call Manager is not in a managed state, it is most of the time due to HTTP or SNMP, if further assistance is needed open a TAC case to get the call manager in a Managed state.
Step 6. Navigate to Inventory > Inventory Schedule > Cluster Data Discovery Schedule and select Run Now.
Note: This is dependant on how many registered/non-registered devices you have. This process may take anywhere from a few minutes to a few hours. Check throughout the day by a refresh of the page. As well, this maps your Call Manager cluster together and retrieves all of your endpoints. After this is complete, proceed to the next step.
Note: It is important to mention in the PCA inventory if there are any endpoints where you want to have conference statistics that are supported. Ensure that these are well managed for reports and all the statistics, to show the correct information.
Step 7. Navigate to Diagnose > Endpoint Diagnostics.
In order to obtain upto date statistics for your conference endpoints you need to set their visibility to the highest level possible that is allowed by the system.
Select all the endpoints you want to monitor in the Conference Diagnostics then click Edit Visibility and then select Full Visibility as shown in the image.
Limited Visibility only shows the device within the topology but no statistics and it is not able to retrieve applicable alarms for those devices related to Conference Diagnostics.

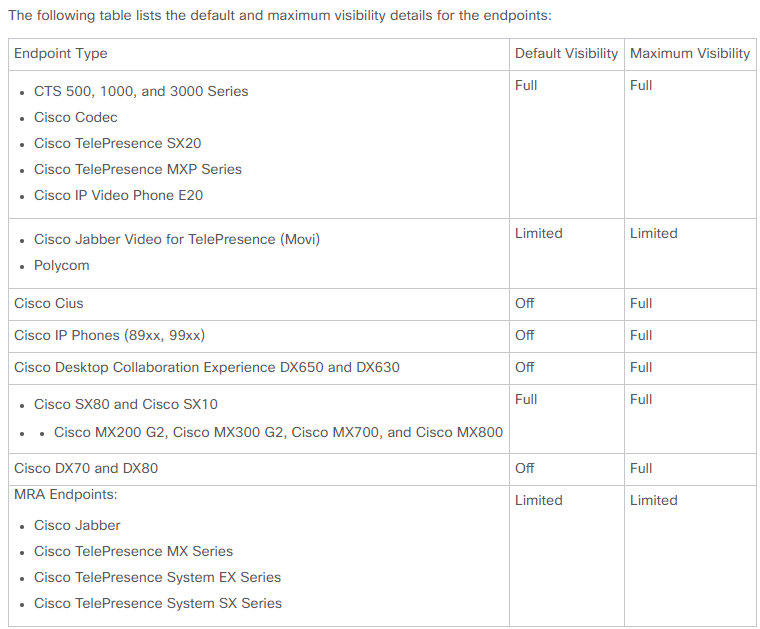
Note: If you select, for example, 10 endpoints and select Full Visibility it selects the highest level of visibility support per device.
Step 8. In order to test, navigate to Diagnose > Conference Diagnostics and a Conference In progress or completed shows, as shown in the image.

Within these conferences you are able to view the Average Packet loss, latency and Jitter for Audio and Video calls.
Also, obtain a topology of the Session and the devices involved.
Currently, the Conference Diagnostics pulls the information based off of DN and if your enviornment has shared DN's, PCA retrieves the first one it receives for the conference.
Conference Relatable Alarms
For Conference Diagnostics you are able to receive three different Alarms for any session and set their thresholds:
- Packet Loss
- Latency
- Jitter
For each of these, you can modify the default threshold, surpress it or define what devices you would like associated to this alarm.
Step 1. Navigate to Alarm & Report Administration > Event Customization.
Step 2. Select Threshold Rules and ensure you have Basic selected.
Step 3. Scroll down or filter to your right for the Category Named Session as shown in the image.
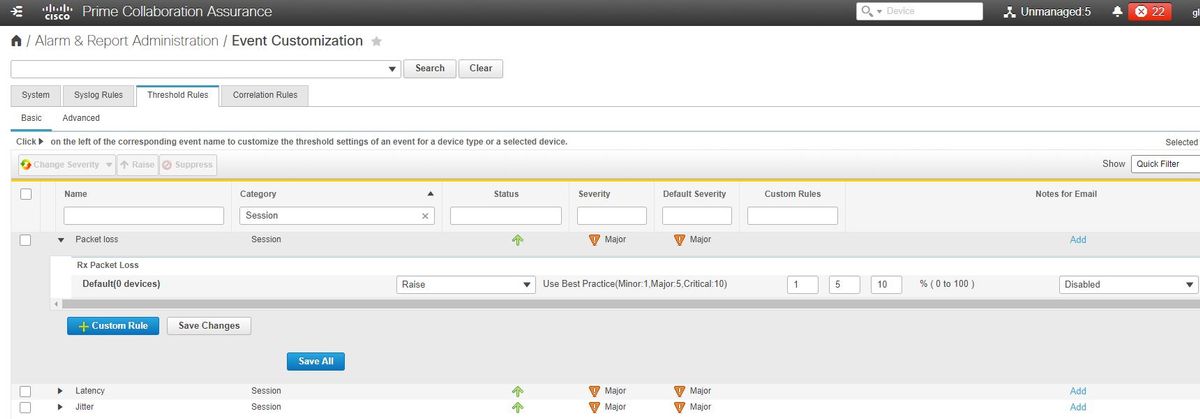
Step 4. Select the drop down arrow that is next to the alarm. You want to modify and you can modify the Minor, Major or Critical percentages for Packet Loss, Jitter or Latency.
Step 5. If you would like to surpress then switch the Raise to Surpress.
Step 6. If you would like to define the endpoints associated to the alarm you can select Custom Rule.
Step 7. Next, Select the Device Type > Select All Devices or Selectable Devices that you want for this alarm and click Save.
Conference Relatable Reports
For the Conference Diagnostics reports can be retrieved and viewed.
There are two reports:
- Conference Reports
- Telepresence Endpoint Reports
For Conference Reports, you can view a list of all conferences within a time-frame from one to four weeks or a custom period of time as needed.
Step 1. Navigate to Reports > Conference Reports as shown in the image.

Conference Summary Reports
This reports delivers a view of every endpoint that you have selected as limited/full visibility and their conferences.
Statistics shown here are:
- Average Conference Usage
- Alarms related to the conference
- Average Packet Loss, Jitter and Latency
- Longest Conference
This can help you achieve a granular view into issues where you can have within your Voice/Video network to determine which endpoints have the most issues.
Also, you can utilize your bandwidth in correspondance per usage.
Conference Detail Report Tab
If you do encounter an alarm for a Conference you can navigate to the Conference Detail Report Tab.
Once you select the Conference, you can refine it to find the Endpoint name, Software version and other details you may be interested in.
For Telepresence Endpoint Reports, you can view per endpoint the:
- Number of conferences this device had
- Utilization percentage
- Endpoint Model
- Usage
In addition, you can change the Utilization Paramaters by the Change Utilization Tab as shown in the image.
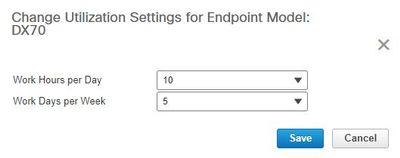
This sets the parameters for that device so the system knows from the usage what percentage to display.
The No Show Endpoint Summary Report displays the Endpoints that had missed scheduled Conferences.
Within this graph, you can also view the Endpoint and how many Total Scheduled Conferences and how many of these did occur and were no shows.
Conference Video Test Call
You can create point-to-point video test calls between two video endpoints in managed state, to test your network. You can see events and alarms, session statistics, endpoint statistics, and network topology with statistics like other calls. Only the CTS, C and EX series codecs are supported for this call.
In addition, this can be used to validate everything is functional with conference diagnostics.
Prerequisites
- This feature is not supported for E20 codec series.
- In order to use this feature, CLI credentials must be added for the endpoints.
- Ensure that the endpoints are registered and JTAPI is enabled for endpoints (if they are registered to Unified CM).
- The Video Test Call feature is not available, if you have deployed Cisco Prime Collaboration in MSP mode.
Step 1. Navigate to Diagnose > Endpoint Diagnostics.
Step 2. Select two applicable endpoints as per the prerequisites mentioned.
Step 3. Select Run Tests > Video Test Call.
Step 4. You can schedule the Video Test Call to run Now or on a re-occurance schedule.
Step 5. This Video Test Call then shows in the Conference Diagnostics Screen.
Scenario 2. Conference with Non Call Manager Registered Endpoints
Step 1. Ensure that the Telepresence Management Suite (TMS) and Video Communications Server(s) (VCS) credentials are available.
Note: When you discover your VCS/TMS in this scenario, the discovery process is important. If you do have a call manager in your setup, discover the conductor first then the Cisco Call Manager.
Step 2. Navigate to Inventory > Inventory Management > Manage Credentials > Select Add and then enter the information for your TMS, while you create a seperate credential Profile for your VCS's as shown in the image.
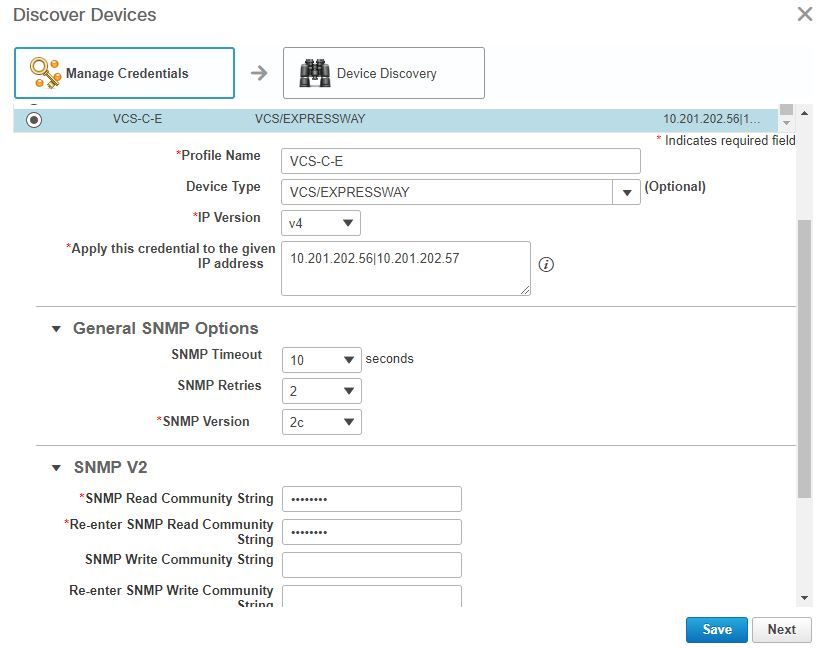
Step 3. Once the credential profile is created, select Device Discovery, enter the ip addresses and in the Discovery tab select VCS and discover the VCS devices. Also, select TMS for the TMS and enter in it's ip address. Click Run Now as shown in the image.
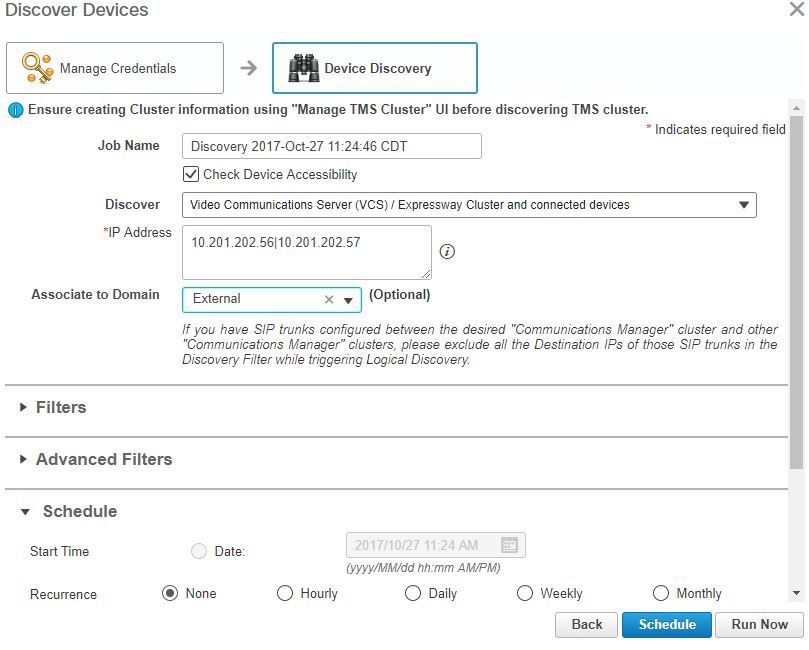
Step 4. Ensure the VCS and TMS are in a Managed state.
Note: If the VCS or TMS is not in a managed state, it is most of the time due to HTTP or SNMP, if further assistance is needed open a TAC case to get the VCS/TMS in a Managed state.
Note: Use this url and replace the IP_Address _of_VCS_Server with the appropriate IP Address once the VCS is in a Managed state.The PCA server must be registered as a feedback server to VCS, this ensures that when a conference session ends there is no issue with the data VCS sends back to PCA.
https://<IP_Address_of_VCS_Server>/getxml?location+/Status/feedback , the http credentials are requested and once input, you must receive a response as shown in the image.
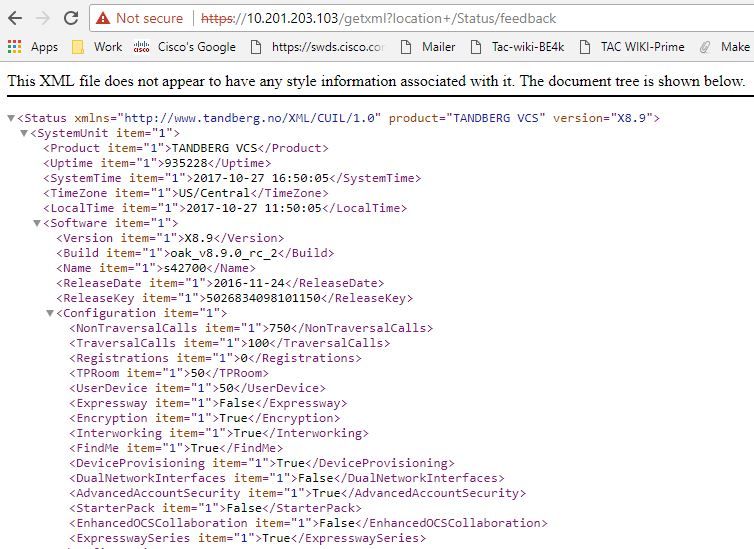
Note: If Prime Collaboration is not subscribed to VCS through HTTP feedback subscription, it is not to be notified by the VCS when a registered endpoint joins or leaves a session, or registers or unregisters to VCS. In this case, set the visibility of those endpoint(s) to full or limited as required and ensure your VCS is in a Managed state.
Step 5. Navigate to Inventory > Inventory Schedule > Cluster Data Discovery Schedule and select Run Now.
Note: This process can take some time as it performs this function across all infrastructure devices. Therefore, if it does not complete after a few minutes, re-check after 1-2 hours. Very large systems can take up to 4 hours. It is important to mention in the PCA inventory if there are any endpoints where you want to have conference statistics that are supported and that you also ensure these as well are managed for reports and all statistics to show the proper information.
For a list of supported devices as per PCA in regards to conferences and our supported sessions, refer to the Background Information section.
Step 6. Navigate to Diagnose > Endpoint Diagnostics.
In order to obtain correct statistics for the conference endpoints, you need to set their visibility to the highest level possible allowed by the system.
Select all the endpoints you want to monitor in the Conference Diagnostics then click Edit Visibility and then select the maximum visibility.

Note: If you select, for example, 10 endpoints and select Full Visibility it selects the highest level of visibility support per device.
Step 7. In order to test, navigate to Diagnose > Conference Diagnostics and a Conference In progress or completed is as shown in the image.
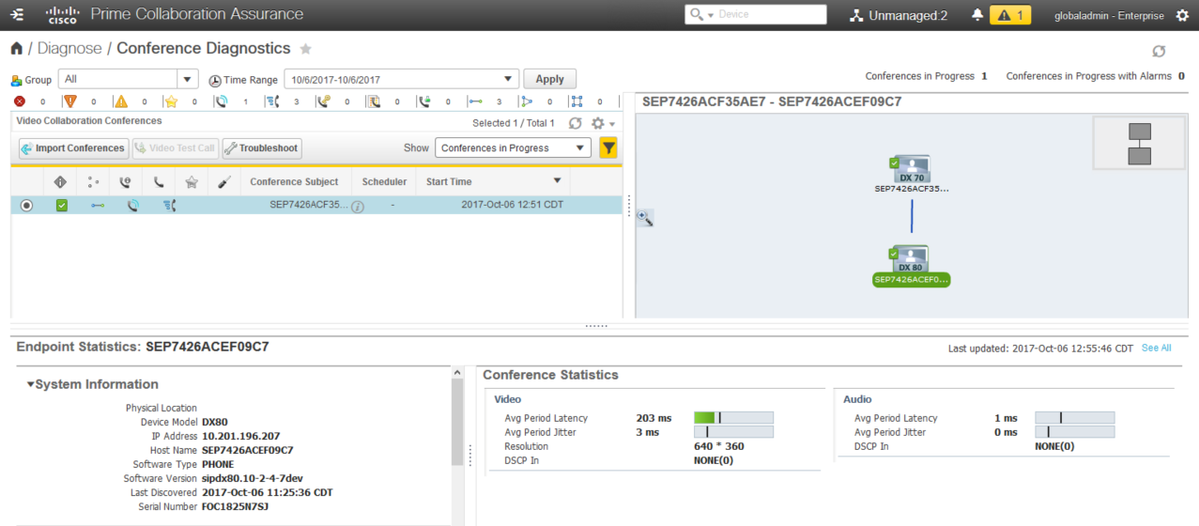
Within these conferences you are able to view the Average Packet loss, latency and Jitter for Audio and Video calls.
Also, you obtain a topology of the Session and the devices involved.
Conference Relatable Alarms
For Conference Diagnostics, you are able to receive three different Alarms any session and set their thressholds:
- Packet Loss
- Latency
- Jitter
Each of these you can modify the default threshold,disable it entirely or define what devices you would like associated to this alarm.
Step 1. Navigate to Alarm & Report Administration >Event Customization.
Step 2. Select Threshold Rules and ensure you have Basic selected.
Step 3. Scroll down or filter to your right for the Category Named Session as shown in the image.

Step 4. Select the drop down arrow next to the alarm you want to modify and you can modify the Minor, Major or Critical percentages for Packet Loss, Jitter or Latency.
Step 5. If you would like to surpress itthen switch the Raise to Surpress.
Step 6. If you would like to define the endpoints associated to the alarm you would select Custom Rule.
Step 7. Next, Select Device Type > Select All devices or Selectable devices that you want for this alarm and click Save.
Conference Relatable Reports
For the Conference Diagnostics reports can be retrieved and viewed.
There are two reports:
- Conference Reports
- Telepresence Endpoint Reports
For Conference Reports, you can view a list of all conferences within a time-frame from one to four weeks or a custom period of time as needed.
Step 1. Navigate to Report > Conference Reports as shown in the image.
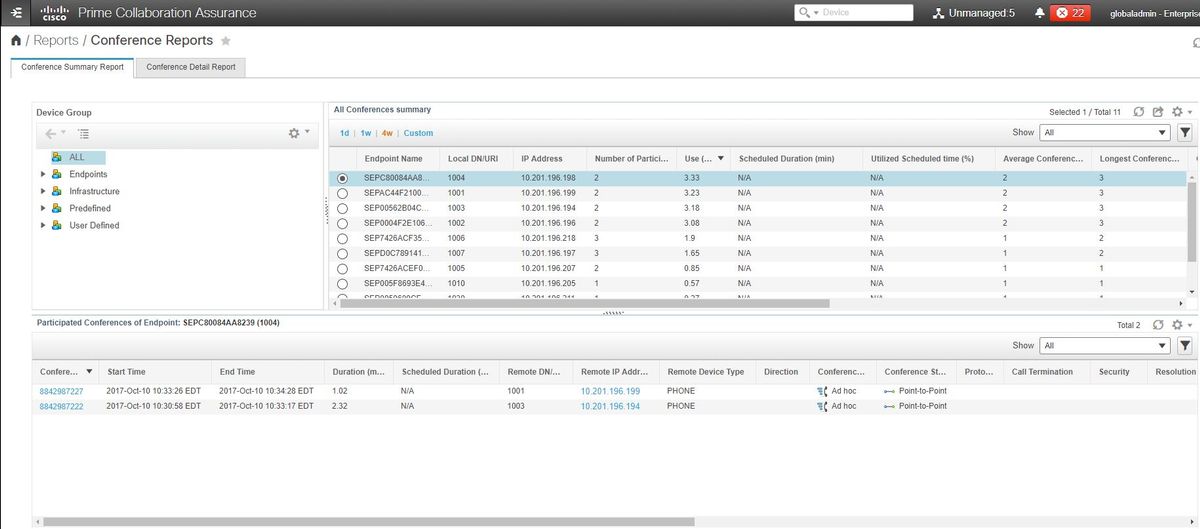
Conference Summary Reports
This reports delivers a view of every endpoint you have selected as limited/full visibility and their conferences.
Statistics shown here are:
- Average Conference Usage
- Alarms related to the conference
- Average Packet Loss, Jitter and Latency
- Longest Conference
This can help you achieve a granular view into issues you may have within your Voice/Video network to determine which endpoints have the most issues.
As well utilize your bandwidth in correspondance per usage
Conference Detail Report Tab
If you do encounter an alarm for a Conference, you can navigate to the Conference Detail Report Tab.
Once you select the Conference you can refine to find the Endpoint name, Software version and other details you maye be interested in.
For Telepresence Endpoint Reports you can view per endpoint the-
- Number of conferences this device had
- Utilization percentage
- Endpoint Model
- Usage
In addition, you can change the Utilization Paramaters by the Change Utilization Tab as shown in the image.

This sets the parameters for that device so the system knows from the usage what percentage to display.
The No Show Endpoint Summary Report displays the Endpoints that had missed scheduled Conferences.
Within this graph, you can view the Endpoint and how many Total Scheduled Conferences and how many of these did occur and were no shows.
Conference Video Test Call
You can create point-to-point video test calls between two video endpoints that are in a managed state, to test your network. You can see events and alarms, session statistics, endpoint statistics, and network topology. Only the CTS, C and EX series codecs are supported for this call.
In addition, this can be used to validate all functionality is correct with conference diagnostics.
Prerequisites
- This feature is not supported for E20 codec series.
- In order to use this feature, CLI credentials must be added for the endpoints.
- Ensure that the endpoints are registered and JTAPI is enabled for endpoints (if they are registered to Unified CM).
- The Video Test Call feature is not available if you have deployed Cisco Prime Collaboration in MSP mode.
Step 1. Navigate to Diagnose > Endpoint Diagnostics.
Step 2. Select two applicable endpoints as per the prerequisites.
Step 3. Select Run Tests > Video Test Call.
Step 4. You can schedule the Video Test Call to run Now or on a re-occurance schedule.
Step 5. This Video Test Call then shows in the Conference Diagnostics Screen.
Verify
There is currently no verification procedure available for this configuration.
Troubleshoot
This section provides information you can use in order to troubleshoot your configuration.
Logs to Collect for Troubleshooting
Step 1. Navigate to System Administration > Log Management.
Step 2. Scroll down to the module and select Session Monitoring and select Edit as shown in the image.
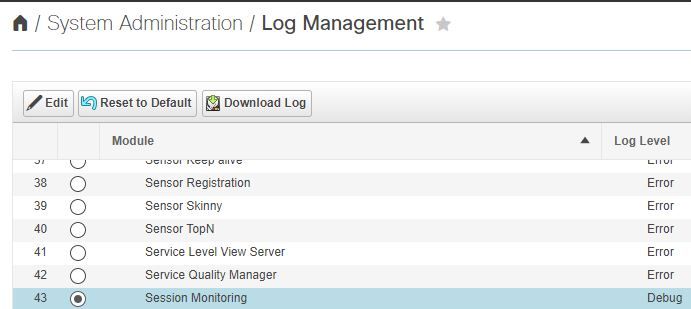
Step 3. Change the log level to debug and click Save.
Step 4. Reproduce the issue then come back to the Log Management Screen.
Step 5. After you reproduce the issue, select Session Monitoring and select Download Log.
Step 6. After you download, extract the zip file.
Step 7. Open up the zip file and navigate to the locations for useful logs:
/opt/emms/emsam/log/SessionMon/
- CUCMJTAPI.log
- CUCMJTAPIDiag.log
- CSMTracker
- CSMTrackerDiag.log
- CSMTrackerDataSource.log
- PostInitSessionMon.log
Contributed by Cisco Engineers
- Joseph KoglinCisco TAC Engineer
Contact Cisco
- Open a Support Case

- (Requires a Cisco Service Contract)
 Feedback