Automate Bandwidth on Demand Use Case via Closed Loop Automation Software Stack
Available Languages
Download Options
Bias-Free Language
The documentation set for this product strives to use bias-free language. For the purposes of this documentation set, bias-free is defined as language that does not imply discrimination based on age, disability, gender, racial identity, ethnic identity, sexual orientation, socioeconomic status, and intersectionality. Exceptions may be present in the documentation due to language that is hardcoded in the user interfaces of the product software, language used based on RFP documentation, or language that is used by a referenced third-party product. Learn more about how Cisco is using Inclusive Language.
Contents
Introduction
This document describes components in a Cisco closed-loop automation solution for Generic Routing Encapsulation (GRE) tunnel scaling automation and its adaptability for other cases.
Background Information
Service providers want to take control of their bandwidth utilizations across the GRE tunnels across their network and monitor them closely to scale tunnels as required using a smart closed-loop automation solution.
GRE is a tunneling protocol that provides a simple generic approach to transport packets of one protocol over another using encapsulation. This document focuses on the GRE Tunnel-based example for the Cisco IOS® XRv Platform but can also be generalized to other platforms. GRE encapsulates a payload, an inner packet that needs to be delivered to a destination network inside an outer IP packet. The GRE tunnel behaves as a virtual point-to-point link with two endpoints identified by the tunnel source and tunnel destination address.
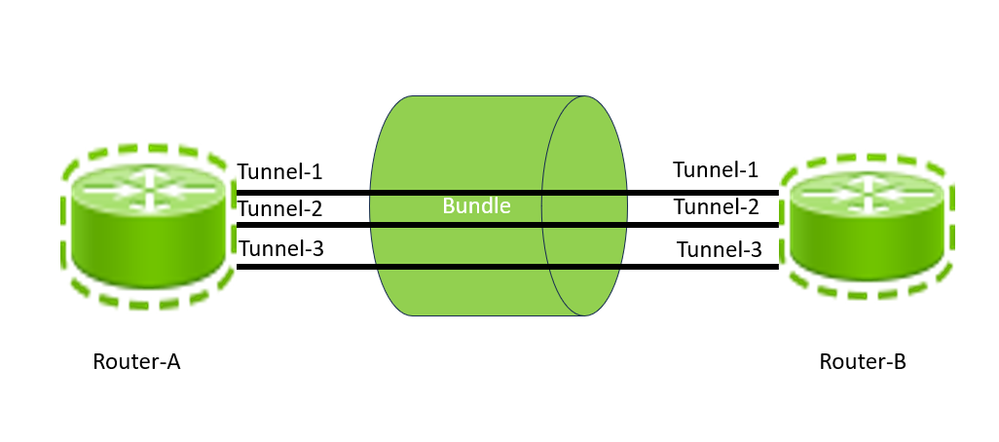 GRE Tunnels Between Routers
Configuring a GRE tunnel involves creating a tunnel interface and defining the tunnel source and destination. This image shows the configuration of three GRE tunnels between Router-A and Router-B. For this configuration, one must create three interfaces, each on Router-A, such as Tunnel-1, Tunnel-2, and Tunnel-3, and similarly create three interfaces on Router-B, such as Tunnel-1, Tunnel-2, and Tunnel-3. Between two service provider routers, there can be multiple GRE Tunnels. Each Tunnel, just like any other networking interface, has a defined capacity which is based on interface capacity. Therefore, a tunnel can only carry a maximum traffic equal to its bandwidth. The number of tunnels is often based on the initial prediction of traffic load and bandwidth utilization between two sites (Routers). With network and network expansion changes, this bandwidth utilization is expected to change. To make optimal use of the network bandwidth, it is important to add new tunnels or remove extra tunnels between two devices based on the bandwidth utilization measured across all the tunnels between the two devices.
From this example, you can say that the total capacity of all three tunnels between Router-A and Router-B is the sum of the capacities of Tunnel-1, Tunnel-2, and Tunnel-3, which is called aggregated bandwidth or GRE bundle-level bandwidth. Please note that the 'bundle' keyword here refers to the tunnels between a pair of routers; no implicit relation with LACP/Etherchannel link bundling is intended. Also, the actual traffic between the two routers is the total aggregated traffic across Tunnel-1, Tunnel-2, and Tunnel-3. Usually, you can devise a concept of bundle-level bandwidth utilization, which can be a ratio of total traffic through the tunnels to the total capacity of all the tunnels between two routers. Generally, any service provider wants to take remediation action by adding or removing tunnels between two routers if they observe that the bandwidth is getting overutilized or underutilized. However, for this document, consider that the lower threshold is 20% for low utilization and 80% for high utilization for the bundle level utilization between two routers.
Requirements
- The closed-loop solution is required to perform end-to-end closed-loop automation of the GRE Bundle on XRv9K where the system can collect telemetry data, monitor the data in the form of Key Performance Indicators (KPIs), Apply Aggregation, Create Threshold Cross Alerts (TCA) and Perform Automated Remediation Configuration and Close the Alert.
- The solution can calculate a Network Key Performance Indicator (KPI) to provide the individual Tunnel Ingress (Rx) and Tunnel Egress (Tx) Bandwidth Utilization of every Tunnel which is based on the raw throughput of tunnels at a desired frequency.
- The solution can be able to calculate custom KPIs to provide the Tunnel Ingress (Rx) and Tunnel Egress (Tx) Bandwidth Utilization of every Bundle which is the Aggregated bandwidth utilization of all the tunnels between a pair of routers.
- The solution can detect and create alerts if the defined Bundle Level Thresholds are crossed. Such alerts are available for monitoring.
- The alert must result in the triggering of an automated workflow which can further trigger configuration on the device to either add or remove tunnels based on the alert conditions.
- Finally, the system must automatically close the alerts with required updates.
Solution
The Closed Loop Automation Solution involves multiple tools that work on the specific goal in this entire end-to-end solution. This image shows which components and tools help us achieve the final architecture and outlines the high-level role. You can look at each component and its use in the subsequent sections.
Cisco Closed Loop Automation Solution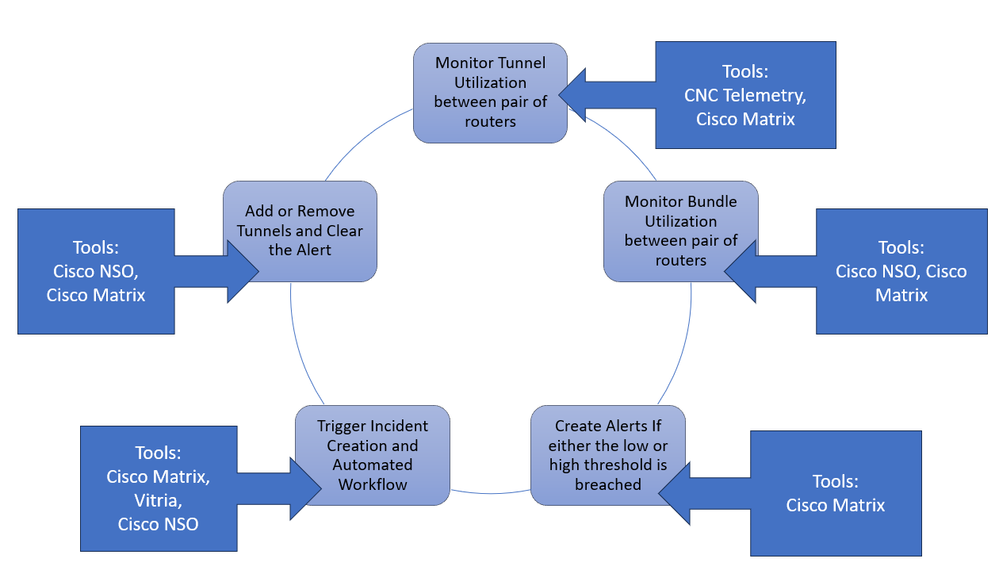 Cisco Closed Loop Automation Solution
|
Tool |
Purpose |
|
Cisco Crosswork Network Controller (CNC) |
Crosswork Network Controller enables real-time visibility across the service and device lifecycle, with intuitive navigation across network topology, service inventory, transport policies, service health, device health, and more supporting a breadth of use cases with a common and integrated user experience.
In this Solution, it is used as a tool primarily for the management of devices and collection of tunnel performance data collection using gNMI (gRPC Network Management Interface) or MDT.
More Details: https://www.cisco.com/site/us/en/products/networking/software/crosswork-network-controller/index.html |
|
Cisco Matrix |
CX analytics services (function packs) are delivered utilizing the Matrix solution, which is a multi-vendor single pane of glass, multi-domain analytics solution.
In this Solution, the Matrix consumes the data from Kafka sent by CNC over the Kafka Topics and further performs aggregation of tunnel-based KPI into Bundle level KPI using topology lookups and store it as a time series data and store it in the Postgres Database. Once stored such data is available for visualization and Matrix has anomaly detection using threshold crossing alerts which allows us to configure thresholds for the KPIs that we collect from the network. |
|
Kafka Cluster |
A Kafka cluster is a system that comprises different brokers' topics, and their respective partitions. A producer sends or writes data/messages to the topic within the cluster. A consumer reads or consumes messages from the Kafka cluster. In this solution, CNC acts as the Producer which sends data to predefined Kafka topics in the form of JSON payload after converting data from Telemetry collected from routers. In this solution, Matrix acts as the Consumer which consumes this data, processes the data, aggregates the data, and stores it for further processing and anomaly detection. |
|
Cisco NSO |
Cisco Crosswork Network Services Orchestrator (NSO) NSO is part of the Crosswork portfolio of automation tooling built for service providers and large enterprises. In this solution, NSO collects information related to all the tunnels and devices and builds a customized topology table for this solution. Also, in this solution, NSO along with Business Process Automation capabilities is used to trigger a remediation workflow and take action like adding or removing a tunnel from the device and further clearing alerts in the Cisco Matrix.
More Details: https://www.cisco.com/c/en/us/products/cloud-systems-management/network-services-orchestrator/index.html |
|
Vitria VIA AIOps |
Vitria VIA AIOps for Cisco Network Automation delivers automated analysis that enables rapid remediation of service-impacting events across all technology and application layers.
In this solution, VIA AIOps is used to correlate KPI threshold events generated from Cisco Matrix create an Incident, Notification, and trigger an automated action towards s Cisco NSO to increase or decrease GRE Tunnel count.
|
The solution takes these steps to fulfill this use case, which are elaborated in the subsequent sections.
- Monitor Tunnel Utilization between pairs of routers
- Monitor Bundle Utilization between pairs of routers
- Create Threshold Crossing Alerts
- Trigger Incident and Automated Remediation Workflow
- Add or Remove Tunnels and Clear Alert
Monitor Tunnel Utilization between Pairs of Routers
Applications request data collection via collection jobs. Cisco Crosswork then assigns these collection jobs to a Cisco Crosswork Data Gateway to serve the request. Crosswork Data Gateway supports data collection from network devices using Model-driven Telemetry (MDT) to consume telemetry streams directly from devices (for Cisco IOS XR-based platforms only). Cisco Crosswork allows you to create external data destinations that can be used by collection jobs to deposit data.Kafka can be added as new data destinations for REST API-created collection jobs. In this solution, CDG collects data from routers related to the tunnel interface statistics and sends the data to Kafta Topic.Cisco Matrix consumes the data from the Kafka Topic and assigns the data to the Matrix worker application which processes the data as a KPI and saves it in a time series manner as shown in the subsequent figure which depicts the process flow.
 Cisco Closed Loop Automation Solution
The time series data has KPI attributes which are stored in the Matrix Database.
|
KPI Attributes |
Purpose |
|
Node |
The device or Source for which KPI is stored Example: Router-A |
|
Time |
The time at which data is collected Example: 22-05-2024 10:00:00 |
|
Index |
Unique identifier Example: Tunnel-1 |
|
Value |
Value of KPI – Numerical Value |
|
KPI |
KPI Name Example: tunnel-utilization |
Monitor Bundle Utilization between Pairs of Routers
Once you have the Time series data as mentioned in the previous section, you have the traffic statistics collected per tunnel interface. However, you need to identify which Device with which source tunnel interface is connected to which other Device and what is the remote interface name. This is called Link Identification where you identify the Source Device Name. Source Interface Name, Remote Device Name, and Remote Interface Name. To accurately interpret the link information and routers, you need a reference example as outlined.
|
Source Device |
Source Interface Name |
Remote Device |
Remote Interface Name |
|
Router-A |
Tunnel-1 |
Router-B |
Tunnel-1 |
|
Router-A |
Tunnel-2 |
Router-B |
Tunnel-2 |
|
Router-A |
Tunnel-3 |
Router-B |
Tunnel-3 |
|
.... |
... |
... |
.. |
To build this topology links table in this solution, you can populate a custom table, Links Data Table, built in Matrix based on a script running on the server every day at the preferred time. This script makes an API call to BPA-NSO and gets back a JSON output of GRE bundles between router pairs. Then it parses the interface data to build the topology in JSON format. The script also takes this JSON output and writes it to the Links Data Table every day. Whenever it loads the new data into the table, it also writes this data to a Redis cache to reduce further database lookups and improve efficiency.
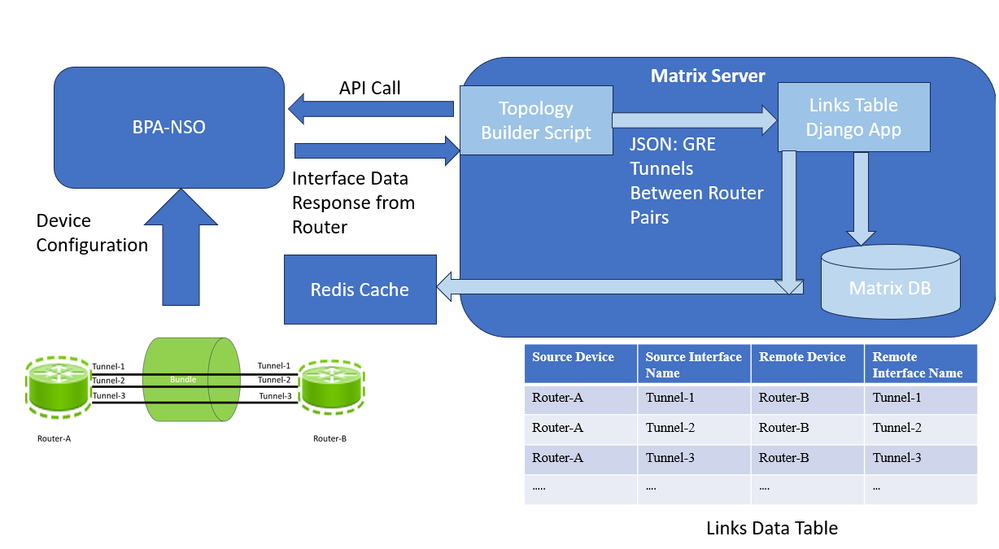 Links Data Table Process
So, necessarily all the links between the same two devices are part of the Bundle that is identified to be belonging to the same bundle.Once the Raw Tunnel level KPIs are available, then you have built a custom KPI_aggregate app on Matrix which performs the job of calculating the Bundle level utilizations and storing them as a KPI.
This application takes these inputs:
|
Configuration Attribute |
Purpose |
|
Crontab |
The frequency at which the aggregation periodic task must run |
|
Enabled Checkbox |
Activate /Deactivate this configuration |
|
Tunnel Interface KPI Name |
Name of the Raw KPI which is used to calculate the aggregate KPI. The Aggregate KPI Name is automatically created as <Raw_KPI_Name>_agg |
|
Date Range |
The frequency of the Raw Data. |
The Aggregate task takes the inputs from the KPI Raw data and Links database identifies the tunnels that form part of the same bundle and adds them to a group based on this logic.
KPI Name: <Raw_KPI_Name>_agg

Example: tunnel_utilization_agg

Value = sum (tunnel_interface_tx_link_utilization of all the interfaces on the device connected to same remote device)/ Number of tunnel interfaces in the group

Index: <local device> _<remote device>

Router-A _Router-B

Node: <Local-Device>

Router-A
For example, in this case, the KPI name is generated as “tunnel-utilization_agg” for the raw Tunnel KPI tunnel-utilization. Once the calculation is completed for all the raw KPI values for all routers and tunnel combinations, this data is pushed for each link to the Kafka topic, which must be the same topic that ingests the processed KPI. That way, this information persists as any other normal KPI received from valid sources. The DB consumer consumes from this topic and persists the KPI into the KPI results table in the Matrix Database for the aggregate KPIs.
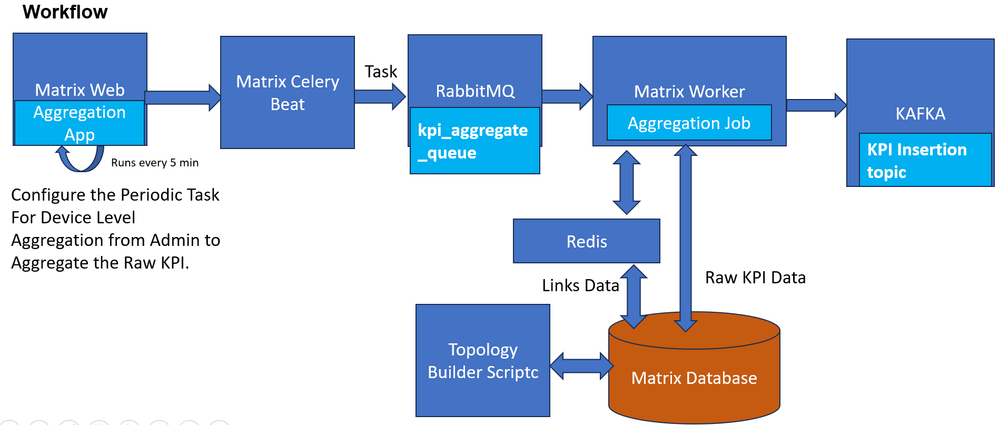 KPI Aggregation Process for Bundle Level Aggregate KPI
Create Threshold Crossing Alerts
The KPI threshold configured in Matrix is 85%, which means when the value of this KPI exceeds the threshold, a critical alert is generated, and when it decreases below the threshold, a clear alert is generated. These alerts are saved in the Matrix Database and also forwarded to Vitria in this solution for the closed-loop automation use case. If the calculated value of the KPI crosses the threshold, an alert is sent to Vitria (VIA-AIOPs) via Kafka with the current state as Critical in the message. Similarly, if the value returns within the threshold values from the critical values, it must send an alert to VIA-AIOPs via Kafka with the current state as Clear in the message. A sample message was sent to the system and its attributes are as follows.
|
{ "node": "Router-A", "node_type": "Router", "kpi": "tunnel_utilization_agg", "kpi_description": " Bundle Level Utilization", "schema": "", "index": "Router-A_Router-B", "time": "2023-08-09 05:45:00+00:00", "value": "86.0", "previous_state": "CLEAR", "current_state": "CRITICAL", "link_name": "Router-A_Router-B" }
|
||
|
Kafka Alert Message Attribute |
Example Value |
Purpose |
|
node |
Router-A |
Network Device Name |
|
node_type |
Router |
Device Type |
|
KPI |
tunnel_utilization_agg |
KPI Name |
|
kpi_description |
Bundle Level Utilization |
KPI Description |
|
Schema |
NA |
NA |
|
index |
Router-A_Router-B |
<local_device>-<remote_device> |
|
time |
"2023-08-09 05:45:00+00:00" |
time |
|
value |
86.0 |
KPI value |
|
previous_state |
CLEAR |
Previous State of alert |
|
current_state |
CRITICAL |
Current State of alert |
|
link_name |
Router-A_Router-B |
Correlation attribute |
link_name attribute is an alphabetically sorted name of the devices present in the index value. This is done to achieve correlation at the VIA AIOPs level where VIA AIOps must correlate the alerts coming from the same Bundle link. For example, when multiple alerts are coming to VIA AIOPs with the same link_name it means the alerts belong to the same bundle link in the network denoted by device names in the link name.
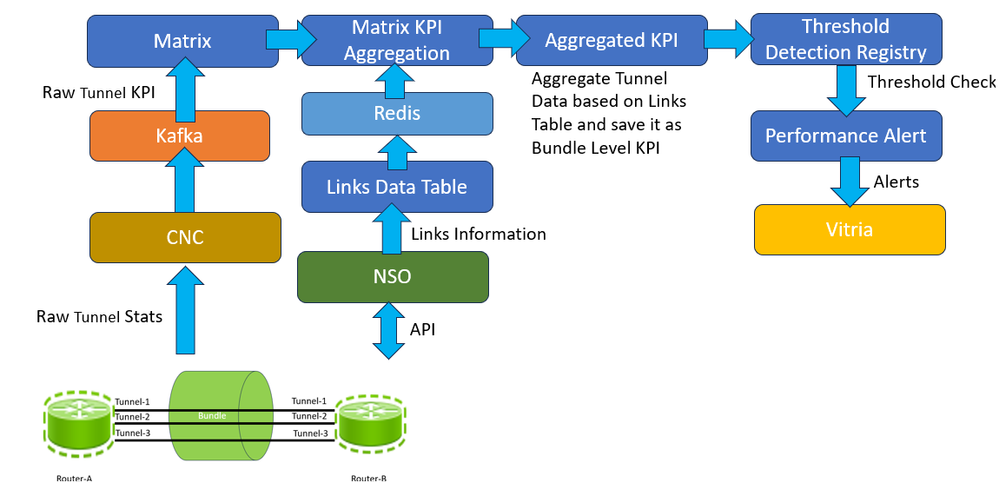 KPI Aggregation Alert Generation using Matrix Detection Registry
Trigger Incident and Automated Remediation Workflow
VIA AIOps is to be configured for the ingestion of Key Performance Indicator (KPI) anomaly events from a designated Kafka topic. These events, as received through Kafka messages, are processed by VIA AIOps through the JASO Event Parser for subsequent ingestion. It is critical for VIA AIOps to precisely identify KPI anomaly events related to GRE tunnels, determine their association with specific device pairs (for example, Router A – Router B), and ascertain whether the anomaly necessitates the initiation of GRE tunnel scaling automation—either an upscale or downscale.
The JASO Event Parser within VIA AIOps must be configured to extract and interpret relevant dimensions from the Matrix KPI anomaly event, namely the ‘host’, 'kpi', 'index', and 'value'. An additional dimension, termed 'automation_action', must be configured to be dynamically updated by the JASO Event Parser, based on the 'value' metric present within the Matrix KPI anomaly event. This dimension is pivotal in determining whether an automated response must be enacted, specifically whether to trigger 'GRE Tunnel Scale Up' or 'GRE Tunnel Scale Down' procedures by processing the ‘KPI value’ field. In VIA AIOps, a signal represents a consolidation of states of the events. To enhance this correlation process, we must configure distinct, stateful signals that correlate to the 'host', 'link name', 'kpi', and 'automation_action' dimensions. The table exemplifies the signals, correlation groups, and their respective correlation configurations.
For instance, the signal identified as GRE_KPIA_SCALEUP would be initiated after the ingestion of a specified KPI anomaly message, as detailed in Section 3, by the VIA AIOps system.
|
VIA AIOps Signal Name |
Signal Correlation Keys |
Correlation Group Rule Name |
|
GRE_KPIA_SCALEUP |
Host,kpi, Link Name, Automated_action |
GRE Tunnel Scale-Up |
|
GRE_KPIB_SCALEUP |
Host,kpi, Link Name, Automated_action |
|
|
GRE_KPIA_SCALEDOWN |
Host,kpi, Link Name, Automated_action |
GRE Tunnel Scale Down |
|
GRE_KPIB_SCALEDOWN |
Host,kpi, Link Name, Automated_action |
The correlation group rule is designed to facilitate the aggregation of signals about Device A, Device B, and their respective tunnels A, B, and C into a unified incident. This correlation rule ensures that for any specific pairing of Device A and Device B, a maximum of two distinct incidents are generated: one incident for a GRE Tunnel Scale-Up involving Device A and Device B, and another incident for a GRE Tunnel Scale-Down for the same device pairing. The VIA AIOps agent framework is capable of interfacing with Business Process Automation (BPA) and Network Services Orchestrator (NSO).
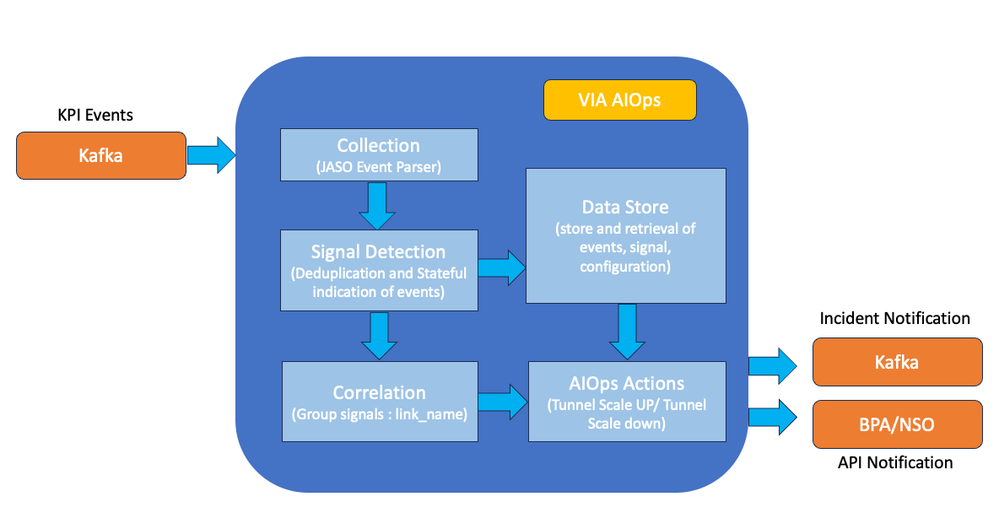 KPI Event Correlation and Notification using VIA AIOps
Here is an example of a GRE Tunnel Scale-Up API notification sent to BPA/NSO from VIA AIOps.
{

  "create": [

    {

      "gre-tunnels-device-cla": [

        {

          "index": "RouterA-RouterB",

          "tunnelOperation": "SCALE UP",

          "MatrixData": [

            { "node": "RouterA", "kpi": "tunnel_utilization_agg" },

            { "node": "RouterB", "kpi": "tunnel_utilization_agg" }

          ]

        }

      ]

    }

  ]

}
Add or Remove Tunnels and Clear Alert
Upon receiving an API call from VIA AIOps, the Cisco Business Process Automation (BPA) initiates the requisite scaling directives, through internal requests to the Cisco Network Service Orchestrator (NSO). The BPA assesses the data payload provided by VIA AIOps, which includes tunnel operation details, an index, and Matrix Data. The index and tunnel operation information is utilized to interface with the NSO, supplying parameters for scaling operation. Concurrently, the Matrix Data is processed by the 'Matrix Update Module', which is responsible for resolving any KPI anomaly events by interfacing with the Matrix APIs.
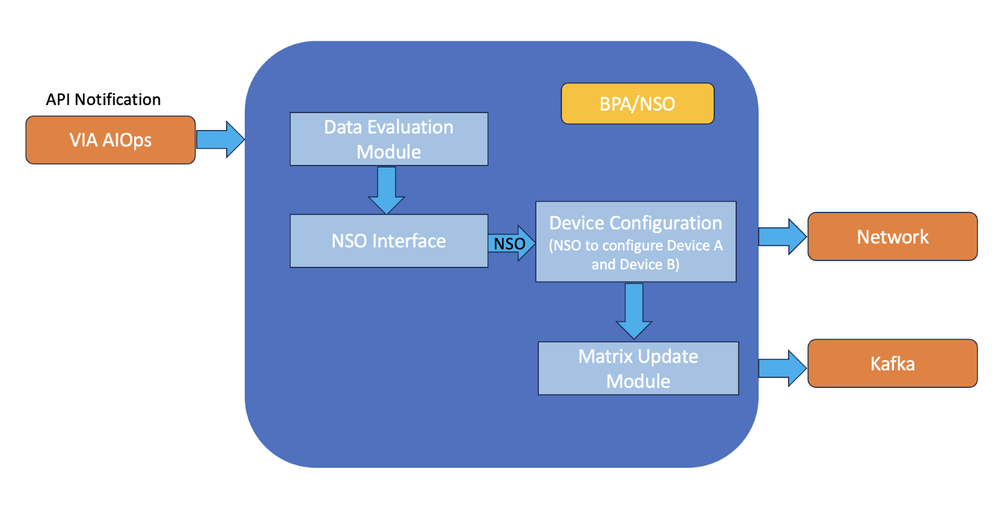 Data validation and device configuration using BPA-NSO
Before initiating any scaling operations, a YANG action model needs to be developed for the NSO. This model defines the specific actions that the NSO must perform to either increase or decrease the tunnel count between Router A and Router B. The Business Process Automation (BPA) system starts scaling operations by engaging with the Network Service Orchestrator (NSO) to conduct a 'dry run'. This is the initial phase of the operation where the BPA requests the NSO to simulate the intended configuration changes without applying them. The dry run functions as an essential validation step, ensuring that the proposed scaling actions, as defined by the YANG action model, can be executed without causing any errors or conflicts in the network configuration.
If the dry run is deemed successful, indicating that the scaling actions are validated, the BPA then moves forward to the 'commit' stage. At this point, the BPA instructs the NSO to implement the actual configuration modifications necessary to increase or decrease the GRE tunnel count between Router A and Router B. The BPA triggers the 'Matrix Update Module' toward Matrix using an API call to close the KPI event in tandem with VIA AIOps. Once this anomaly is closed on Matrix, Matrix also sends an alert with severity as “Cleared” to VIA AIOps, which further closes the incident on its end. In this way, the network-level remediation cycle is complete. A generalized version of the data flow within the application, utilized in this closed-loop automation, is depicted in this image.
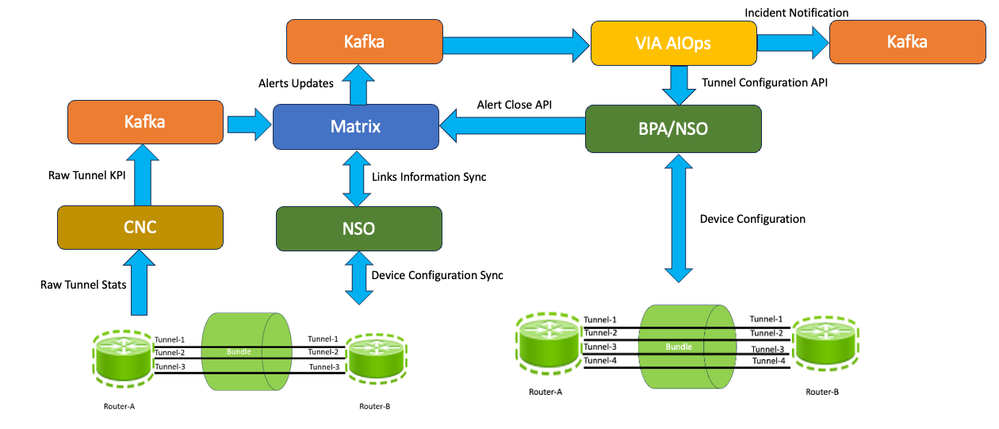 Data Flow for a GRE Tunnel Bundle Closed Loop Automation
Closing the Loop to Open New Possibilities of Automatic Remediation
The solution discussed in this paper is deliberately discussed with one example of GRE Bundle scaling based on network anomalies to help us relate to various building blocks of this solution. It is studied in summary how Cisco Technology Stack which includes Cisco NSO, Cisco Matrix, and Cisco BPA can seamlessly integrate with components like VIA AIOps, Kafka, and another software stack to help us automatically monitor and remediate networking issues. This solution opens up possibilities for all other networking use cases which can be typical issues occurring in Service Provider or Enterprise Networks.
Revision History
| Revision | Publish Date | Comments |
|---|---|---|
1.0 |
18-Aug-2024 |
Initial Release |
Contributed by Cisco Engineers
- Niraj GadheCustomer Delivery Software Architect
- Pranit PatilCustomer Delivery Software Architect
Contact Cisco
- Open a Support Case

- (Requires a Cisco Service Contract)
 Feedback