Understand the APIC Visore Tool
Available Languages
Contents
Introduction
This document describes Visore, the Application Policy Infrastructure Controller (APIC) Object Store Browser. You can use it in order to directly query the Managed Objects (MO) when you point your browser to either the IP address of one of the APICs or a physical switch. One would typically point to the APIC which is generally HTTPS (default), but could also be HTTP if configured.
https://<APIC or Switch IP ADDRESS>/visore.html
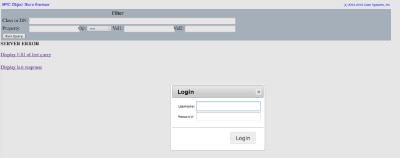
From there, you are prompted to log in with use of credentials valid with the device.
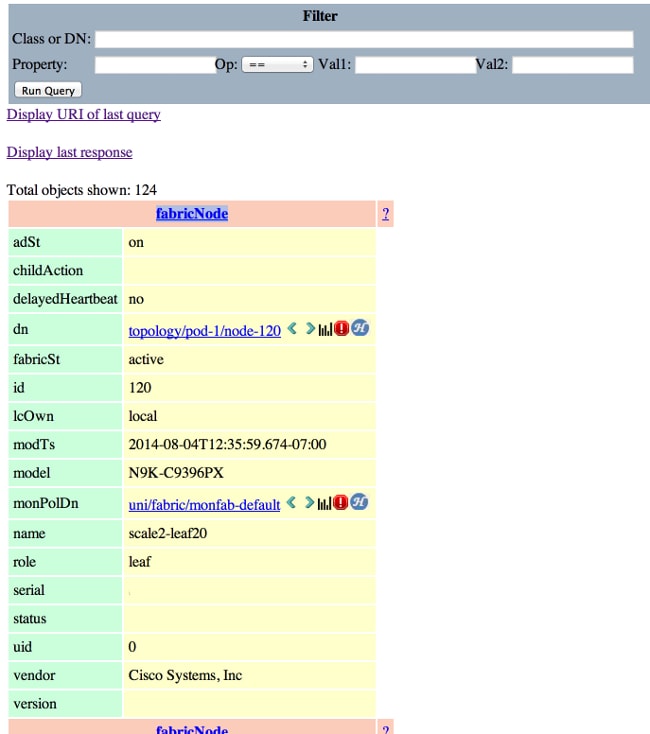
By default, when you log into the APIC Visore it displays the result of a search for all MOs of class fabricNode.
Obtain Class Name or DN
There are four methods that can be used in order to find an object's Class Name (CN) or Distinguished Name (DN).
Enable 'Show Debug Info' from the APIC GUI
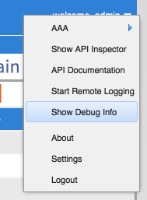
Click Welcome, <userid> and choose Show Debug Info in order to enable the debug information.
Once enabled, when you click around the GUI you will notice the text shown in this image in the bottom left hand corner. You can then use this in order to find the necessary information. You are interested in the latter half of the text, which begins with 'Current MO'. This is the current MO that is displayed. The Class name is in the section after 'model.def.fvAEPg' and the actual name is after the 'model.def'. In this example this is 'fvAEPg'. Furthermore, the DN is displayed within the square brackets [ ]. In this instance, the DN is 'uni/tn-common/ap-default/epg-epg1'.

URL
When you click on a link within the GUI, the URL is updated in order to reflect where you are within the APIC GUI. From this, you can obtain the DN. Everything after the vertical bar ( | ) in the URL is the unique DN. As you can see, this matches what was obtained via the debug method.

Show API Inspector
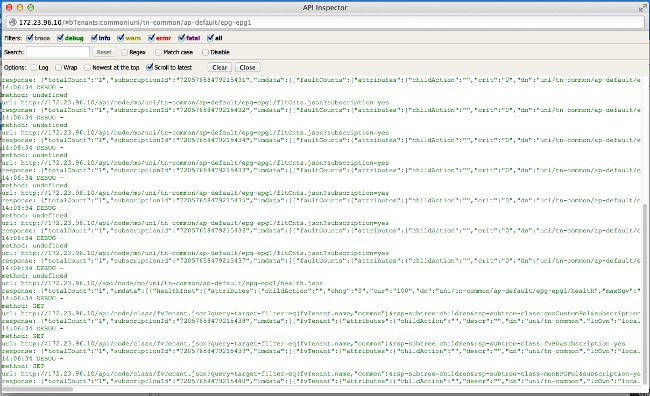
Enter the show API inspector command and review the API calls that are made.
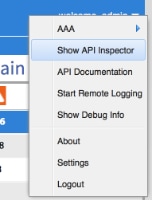
Click Welcome, <userid> and choose Show API Inspector in order to enable the API inspector.
From this output, you see the raw API calls that are made by the GUI to the APIC. You can determine that the DN is 'uni/tn-common/ap-default/epg-epg1' as this is specified in the API URL that is used. Specifically, it is 'http://172.23.96.10/api/node/mo/uni/tn-common/ap-default/epg-epg1/'. In order to break this down, you have the IP address of the APIC, a directory structure of 'api/node/', a call out to an 'MO' instead of a 'class', followed by the DN.
End Point Group (EPG) File
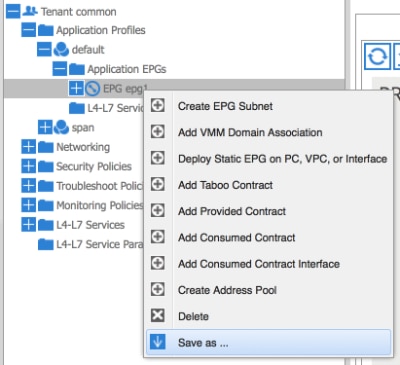
Right-click a policy, save the policy, and open the saved XML file.
Lastly, you can obtain the Class and DN information when you right-click the policy of choice. Choose Save as and then proceed to download the file. In this example, the file is exported as an XML document.
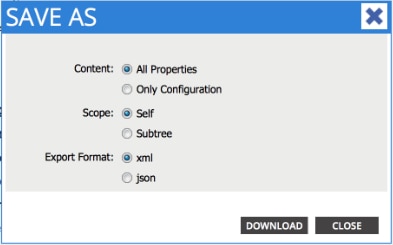
Once the file has been downloaded to your local file system, open it in your favorite editor. Once the file is open, you will be able to inspect the XML/JSON and determine the Class and DN.
With the same example, you can see that the class is highlighted in blue and is equal to 'fvAEPg'. Furthermore, you see the specific text dn='uni/tn-common/ap-default/epg-epg1'.

Execute a Query
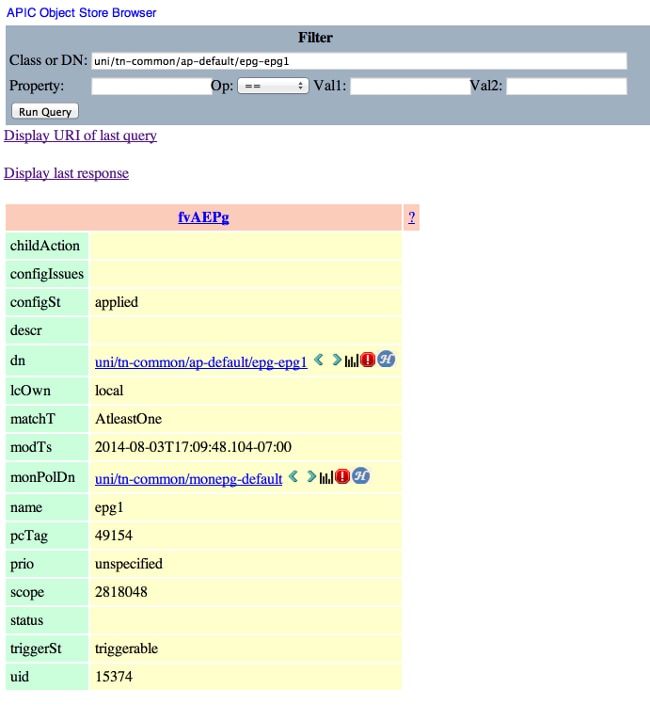
Use the details you found from one of the four methods in the previous section in order to inspect the MO in further detail with Visore.
In order to execute a query, enter either the Class or DN.
Example 1 - DN
Example 2 - Class
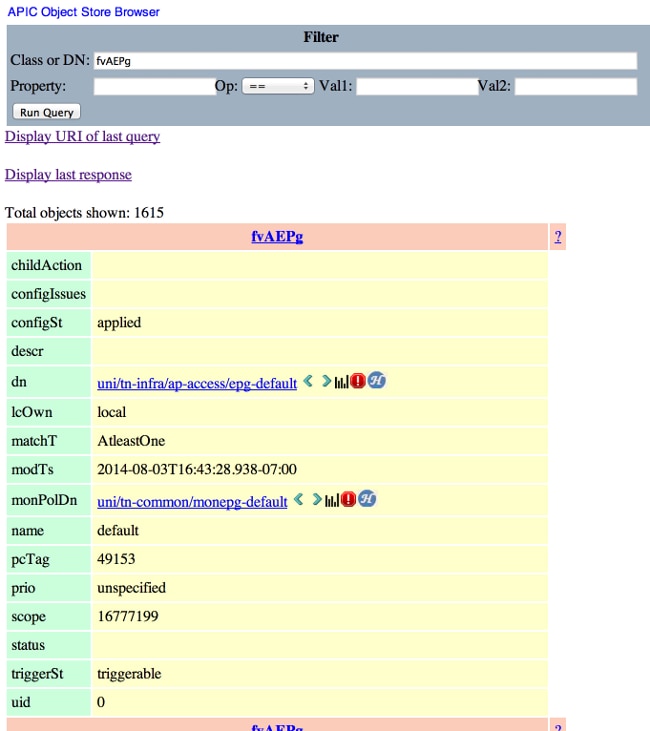
When you search this Class, Visore returns ALL objects of this Class type. As can be seen in the output, this system has 1615 objects of Class type fvAEPg.
Visore Filters
Previously when you searched on the Class type of 'fvAEPg' it returned a result of 1615 objects, but you can narrow this search. For example, perhaps you are only interested in the objects that are within the Application Profile 'ap-default'. As this is contained within the DN, you can filter by the DN as follows:
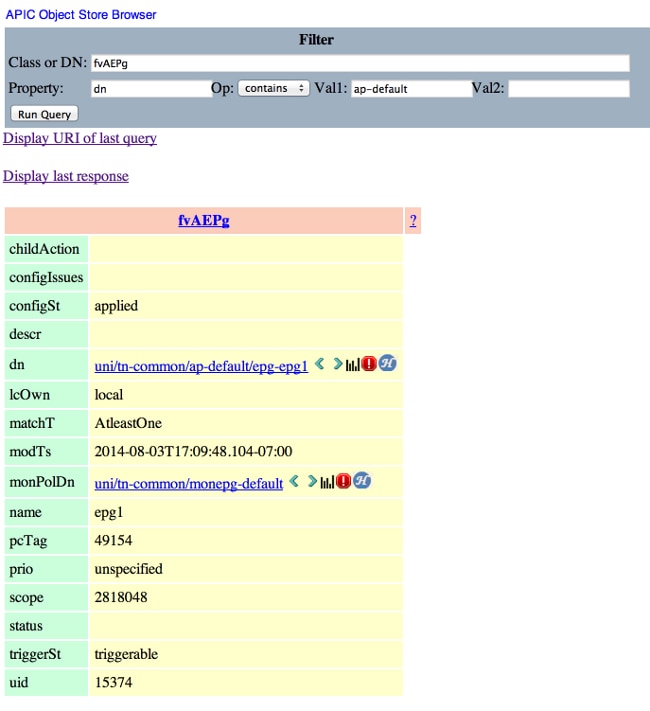
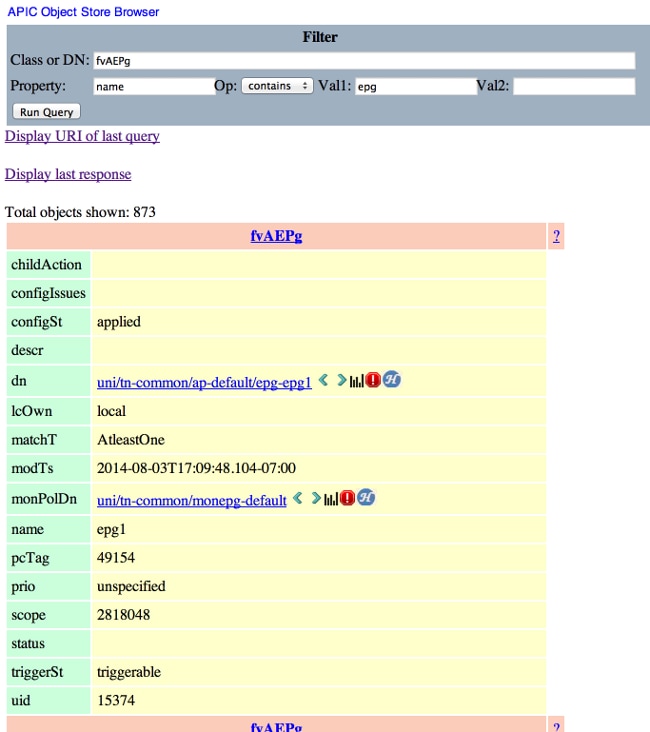
This happens to return a single result as this application profile does not have any additional EPGs. Alternatively, from the original search on 'fvAEPg', you can narrow the list down to 873 when you search for all EPGs that contain 'epg'.
Display URI of the Last Query
This is useful for when you want to play with the API. You can view the actual call made by Visore. You can find similar information with the API Inspector.


Display Last Response
This provides the raw XML output of the last response that was returned. This is what the Visore tool returned and massaged into the table output format shown here. No other type of translation/modification takes place.

Class Object Name
Click the Class Object Name in order to execute a new search and return all objects of that particular Class type.
Click the ? (question mark) in order to display the Model - Property details for that particular class type. It is a very detailed and useful way to learn the object model. Across the top of this help are hyperlinks that link you to further information on this Class.

Toolbar
A description of each each icon in the toolbar, from left to right, is described in this section.

Left Arrow
The left arrow executes a new search that displays the Parent of the Managed Object.
Right Arrow
The right arrow executes a new search that displays the Children of the Managed Object.
Statistics
If supported on the object, this returns an additional list of objects appended to the bottom of the query and displays the associated statistics.
Faults
If supported on the object, this displays any raised faults on the object.
Health
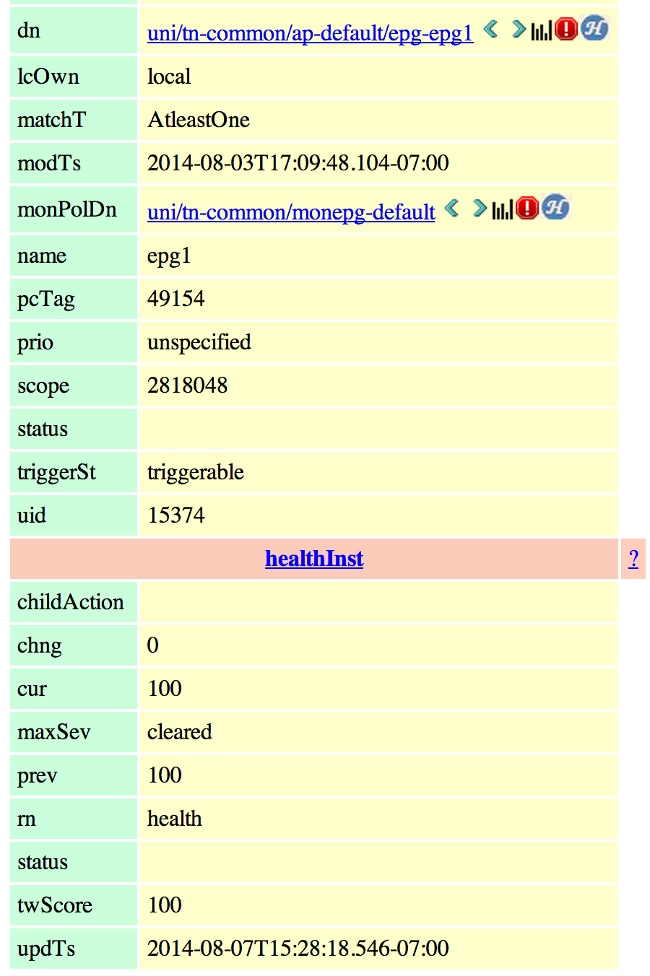
This appends the HealthScore "healthInst" for the DN selected to the bottom of the current query.
Revision History
| Revision | Publish Date | Comments |
|---|---|---|
1.0 |
18-Mar-2015 |
Initial Release |
Contact Cisco
- Open a Support Case

- (Requires a Cisco Service Contract)
 Feedback